.
QGIS GUI
When QGIS starts, you are presented with the GUI as shown in the figure (the numbers 1 through 5 in yellow circles are discussed below).
Figure QGIS GUI 1:
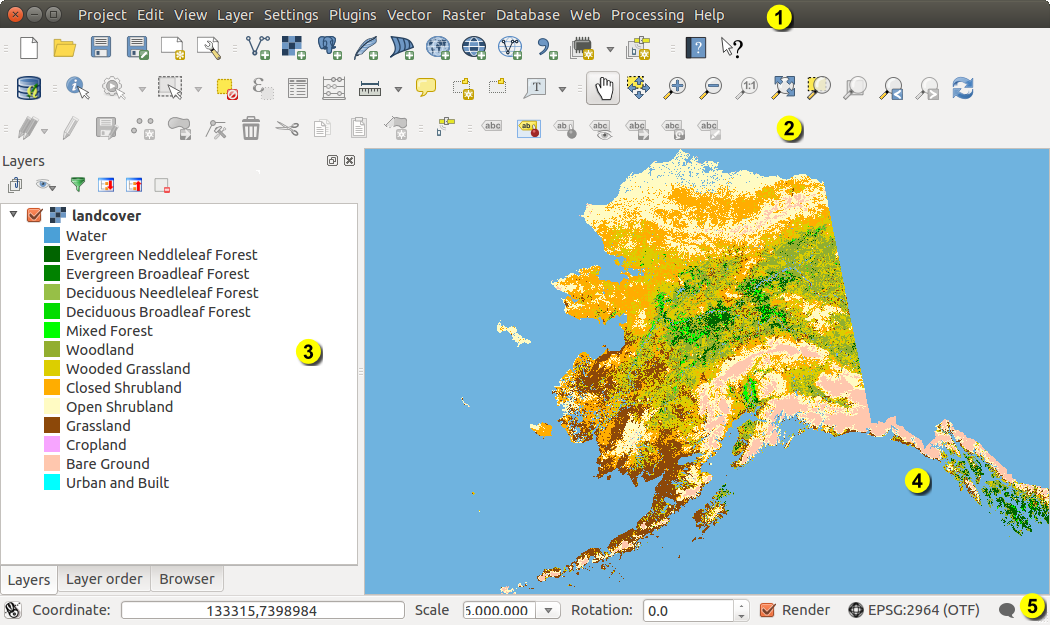
QGIS GUI with Alaska sample data 
Notitie
De weergave van uw venster (titelbalk, etc) kan enigszins afwijken, afhankelijk van uw besturingssysteem en vensterbeheer.
The QGIS GUI is divided into five areas:
Menubalk
- Tool Bar
- Map Legend
Kaartvenster
Statusbalk
These five components of the QGIS interface are described in more detail in the following sections. Two more sections present keyboard shortcuts and context help.
Menubalk
The menu bar provides access to various QGIS features using a standard hierarchical menu. The top-level menus and a summary of some of the menu options are listed below, together with the associated icons as they appear on the toolbar, and keyboard shortcuts. The shortcuts presented in this section are the defaults; however, keyboard shortcuts can also be configured manually using the Configure shortcuts dialog, opened from Settings ‣ Configure Shortcuts....
Alhoewel de meeste menuopties een overeenkomstige functie hebben en vice-versa, zijn de menu’s niet exact ingedeeld zoals de werkbalken. De werkbalk die een functie bevat, wordt eveneens genoemd. Enkele menuopties verschijnen alleen wanneer de overeenkomstige plug-in is geladen. Voor meer informatie over functies en werkbalken, zie gedeelte Werkbalk.
Project
Menuoptie |
Snelkoppeling |
Verwijzing |
Werkbalk |
|---|---|---|---|
 New New |
Ctrl+N | zie Projecten |
Project |
 Open Open |
Ctrl+O | zie Projecten |
Project |
Nieuw van template ‣ |
zie Projecten |
Project | |
| Open Recent ‣ | zie Projecten |
||
 Save Save |
Ctrl+S | zie Projecten |
Project |
 Save As... Save As... |
Ctrl+Shift+S | zie Projecten |
Project |
 Save as Image... Save as Image... |
zie Uitvoer |
||
| DXF Export ... | zie Uitvoer |
||
 New Print Composer New Print Composer |
Ctrl+P | zie Printvormgeving |
Project |
 Composer manager ... Composer manager ... |
zie Printvormgeving |
Project | |
Printvormgeving ‣ |
zie Printvormgeving |
||
 Exit QGIS Exit QGIS |
Ctrl+Q |
Bewerken
Menuoptie |
Snelkoppeling |
Verwijzing |
Werkbalk |
|---|---|---|---|
 Undo Undo |
Ctrl+Z | Geavanceerd digitaliseren |
|
 Redo Redo |
Ctrl+Shift+Z | Geavanceerd digitaliseren |
|
 Cut Features Cut Features |
Ctrl+X | Digitaliseren |
|
 Copy Features Copy Features |
Ctrl+C | Digitaliseren |
|
 Paste Features Paste Features |
Ctrl+V | Digitaliseren |
|
Objecten plakken als ‣ |
|||
 Add Feature Add Feature |
Ctrl+. | Digitaliseren |
|
 Move Feature(s) Move Feature(s) |
Digitaliseren |
||
 Delete Selected Delete Selected |
Digitaliseren |
||
 Rotate Feature(s) Rotate Feature(s) |
Geavanceerd digitaliseren |
||
 Simplify Feature Simplify Feature |
Geavanceerd digitaliseren |
||
 Add Ring Add Ring |
Geavanceerd digitaliseren |
||
 Add Part Add Part |
Geavanceerd digitaliseren |
||
 Fill Ring Fill Ring |
Geavanceerd digitaliseren |
||
 Delete Ring Delete Ring |
Geavanceerd digitaliseren |
||
 Delete Part Delete Part |
Geavanceerd digitaliseren |
||
 Reshape Features Reshape Features |
Geavanceerd digitaliseren |
||
 Offset Curve Offset Curve |
Geavanceerd digitaliseren |
||
 Split Features Split Features |
Geavanceerd digitaliseren |
||
 Split Parts Split Parts |
Geavanceerd digitaliseren |
||
 Merge Selected Features Merge Selected Features |
Geavanceerd digitaliseren |
||
| Merge Attr. of Selected Features |
Geavanceerd digitaliseren |
||
 Node Tool Node Tool |
Digitaliseren |
||
| Rotate Point Symbols |
Geavanceerd digitaliseren |
After activating  Toggle editing mode for a layer,
you will find the Add Feature icon in the Edit menu
depending on the layer type (point, line or polygon).
Toggle editing mode for a layer,
you will find the Add Feature icon in the Edit menu
depending on the layer type (point, line or polygon).
Bewerken (extra)
Menuoptie |
Snelkoppeling |
Verwijzing |
Werkbalk |
|---|---|---|---|
| Add Feature |
Digitaliseren |
||
 Add Feature Add Feature |
Digitaliseren |
||
 Add Feature Add Feature |
Digitaliseren |
Beeld
Menuoptie |
Snelkoppeling |
Verwijzing |
Werkbalk |
|---|---|---|---|
 Pan Map Pan Map |
Kaart navigatie |
||
 Pan Map to Selection Pan Map to Selection |
Kaart navigatie |
||
 Zoom In Zoom In |
Ctrl++ | Kaart navigatie |
|
 Zoom Out Zoom Out |
Ctrl+- | Kaart navigatie |
|
Selecteren ‣ |
Attributen |
||
 Identify Features Identify Features |
Ctrl+Shift+I | Attributen |
|
Opmeten ‣ |
zie Meten |
Attributen |
|
 Zoom Full Zoom Full |
Ctrl+Shift+F | Kaart navigatie |
|
 Zoom To Layer Zoom To Layer |
Kaart navigatie |
||
 Zoom To Selection Zoom To Selection |
Ctrl+J | Kaart navigatie |
|
 Zoom Last Zoom Last |
Kaart navigatie |
||
 Zoom Next Zoom Next |
Kaart navigatie |
||
 Zoom Actual Size Zoom Actual Size |
Kaart navigatie |
||
Decoraties ‣ |
zie Decoraties |
||
modus Voorvertoning ‣ |
|||
 Map Tips Map Tips |
Attributen |
||
 New Bookmark New Bookmark |
Ctrl+B | Attributen |
|
 Show Bookmarks Show Bookmarks |
Ctrl+Shift+B | Attributen |
|
 Refresh Refresh |
F5 | Kaart navigatie |
Kaartlagen
Menuoptie |
Snelkoppeling |
Verwijzing |
Werkbalk |
|---|---|---|---|
Laag maken ‣ |
Kaartlagen bewerken |
||
Laag toevoegen ‣ |
Kaartlagen bewerken |
||
| Embed Layers and Groups ... | |||
| Add from Layer Definition File ... | |||
| Copy style |
see Menu Stijl | ||
| Paste style |
see Menu Stijl | ||
 Open Attribute Table Open Attribute Table |
Attributen |
||
| Toggle Editing |
Digitaliseren |
||
| Save Layer Edits |
Digitaliseren |
||
 Current Edits ‣ Current Edits ‣ |
Digitaliseren |
||
| Save as... | |||
| Save as layer definition file... | |||
 Remove Layer/Group Remove Layer/Group |
Ctrl+D | ||
 Duplicate Layers (s) Duplicate Layers (s) |
|||
Zichtbaarheidsschaal instellen |
|||
| Set CRS of Layer(s) | Ctrl+Shift+C | ||
| Set project CRS from Layer | |||
| Properties ... | |||
| Query... | |||
 Labeling Labeling |
|||
 Add to Overview Add to Overview |
Ctrl+Shift+O | Kaartlagen bewerken |
|
 Add All To Overview Add All To Overview |
|||
 Remove All From Overview Remove All From Overview |
|||
 Show All Layers Show All Layers |
Ctrl+Shift+U | Kaartlagen bewerken |
|
 Hide All Layers Hide All Layers |
Ctrl+Shift+H | Kaartlagen bewerken |
|
| Show selected Layers |
|||
| Hide selected Layers |
Instellingen
Menuoptie |
Snelkoppeling |
Verwijzing |
Werkbalk |
|---|---|---|---|
Panelen ‣ |
|||
Werkbalken ‣ |
|||
| Toggle Full Screen Mode | F 11 | ||
 Project Properties ... Project Properties ... |
Ctrl+Shift+P | zie Projecten |
|
 Custom CRS ... Custom CRS ... |
|||
Stijl-manager... |
zie Presentation |
||
 Configure shortcuts ... Configure shortcuts ... |
|||
| Customization ... |
zie Aanpassingen |
||
| Options ... |
zie Opties |
||
| Snapping Options ... |
Plug-ins
Menuoptie |
Snelkoppeling |
Verwijzing |
Werkbalk |
|---|---|---|---|
 Manage and Install Plugins ... Manage and Install Plugins ... |
|||
| Python Console | Ctrl+Alt+P |
When starting QGIS for the first time not all core plugins are loaded.
Vector
Menuoptie |
Snelkoppeling |
Verwijzing |
Werkbalk |
|---|---|---|---|
OpenStreetMap ‣ |
|||
|
zie Plug-in fTools |
||
|
zie Plug-in fTools |
||
|
zie Plug-in fTools |
||
|
zie Plug-in fTools |
||
|
zie Plug-in fTools |


When starting QGIS for the first time not all core plugins are loaded.
Raster
Menuoptie |
Snelkoppeling |
Verwijzing |
Werkbalk |
|---|---|---|---|
| Raster calculator ... | see Rasterberekeningen |
When starting QGIS for the first time not all core plugins are loaded.
Database
Menuoptie |
Snelkoppeling |
Verwijzing |
Werkbalk |
|---|---|---|---|
| Database ‣ | Database |
When starting QGIS for the first time not all core plugins are loaded.
Web
Menuoptie |
Snelkoppeling |
Verwijzing |
Werkbalk |
|---|---|---|---|
| Metasearch | Web |
When starting QGIS for the first time not all core plugins are loaded.
Processing
Menuoptie |
Snelkoppeling |
Verwijzing |
Werkbalk |
|---|---|---|---|
 Toolbox Toolbox |
zie De Toolbox |
||
 Graphical Modeler ... Graphical Modeler ... |
|||
 History and log ... History and log ... |
|||
 Options ... Options ... |
|||
 Results viewer ... Results viewer ... |
|||
 Commander Commander |
Ctrl+Alt+M |
When starting QGIS for the first time not all core plugins are loaded.
Help
Menuoptie |
Snelkoppeling |
Verwijzing |
Werkbalk |
|---|---|---|---|
 Help Contents Help Contents |
F1 | Help | |
 What’s This? What’s This? |
Shift+F1 | Help | |
| API Documentation | |||
| Need commercial support? | |||
 QGIS Home Page QGIS Home Page |
Ctrl+H | ||
 Check QGIS Version Check QGIS Version |
|||
 About About |
|||
 QGIS Sponsors QGIS Sponsors |
Please note that for Linux , the menu bar items listed above are the
default ones in the KDE window manager. In GNOME, the Settings menu
has different content and its items have to be found here:
| Custom CRS |
Edit |
| Style Manager | Edit |
| Configure Shortcuts |
Edit |
| Customization |
Edit |
| Options |
Edit |
| Snapping Options ... | Edit |
Werkbalk
De werkbalken geven toegang tot de meeste functies die u ook terugvindt in de menu-structuur, plus kaartgereedschap. Elke knop op de werkbalk heeft ook een tooltip, informatie die na een tijdje automatisch verschijnt wanneer u de muisaanwijzer er even boven houdt.
Every menu bar can be moved around according to your needs. Additionally, every menu bar can be switched off using your right mouse button context menu, holding the mouse over the toolbars (read also Panels and Toolbars).
Tip
Werkbalken weer terugzetten
If you have accidentally hidden all your toolbars, you can get them back by choosing menu option Settings ‣ Toolbars ‣. If a toolbar disappears under Windows, which seems to be a problem in QGIS from time to time, you have to remove key \HKEY_CURRENT_USER\Software\QGIS\qgis\UI\state in the registry. When you restart QGIS, the key is written again with the default state, and all toolbars are visible again.
Map Legend
The map legend area lists all the layers in the project. The checkbox in each legend entry can be used to show or hide the layer. The Legend toolbar in the map legend are list allow you to Add group, Manage Layer Visibility of all layers or manage preset layers combination, Filter Legend by Map Content, Expand All or Collapse All and Remove Layer or Group.
Figure Layer tools Bar:
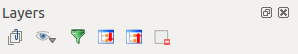
Layer Tool Bar in Map Legend
The button  allows you to add Presets views in the legend. It means that you can choose to display some layer with specific categorization and add this view to the Presets list. To add a preset view just click on , choose Add Preset... from the drop down menu and give a name to the preset. After that you will see a list with all the presets that you can recall pressing on the button.
Alle toegevoegde voorkeuzen zijn ook aanwezig in de Printvormgeving om u in staat te stellen een kaartopmaak te maken die is gebaseerd op uw specifieke weergaven (zie Algemene eigenschappen).
Een laag kan na selectie hoger of lager in de legenda gezet worden door deze te slepen met ingedrukte linker muisknop. Hoe hoger in de legenda, hoe later deze laag getekend wordt. De bovenste kaartlaag wordt dan ook over alle andere kaartlagen getekend.
Notitie
This behaviour can be overridden by the ‘Layer order’ panel.
Layers in the legend window can be organised into groups. There are two ways to do this:
- Press the
 icon to add a new group. Type in a name for
the group and press Enter. Now click on an existing layer and
drag it onto the group.
icon to add a new group. Type in a name for
the group and press Enter. Now click on an existing layer and
drag it onto the group. Selecteer enkele lagen, start met de rechter muisknop het snelmenu vanuit het paneel van de legenda en kies Groep geselecteerd. De geselecteerde lagen zullen automatisch aan de nieuwe groep worden toegevoegd.
Om een laag uit een groep te halen kunt u deze eruit slepen, of door een laag in een groep te selecteren en dan via de rechtermuis het snelmenu te openen en te kiezen voor Maak hier een item op het hoogste niveau van. Een groep kan groepen bevatten.
Met het keuzevak kunt u met één klik de zichtbaarheid van alle lagen die behoren tot die groep aan- of uitzetten.
The content of the right mouse button context menu depends on whether the
selected legend item is a raster or a vector layer. For GRASS vector layers,
Toggle editing is not available. See section
Digitaliseren en bewerken van een GRASS vectorlaag for information on editing GRASS vector layers.
Right mouse button menu for raster layers
- Zoom to Layer
- Show in overview
- Zoom to Best Scale (100%)
- Remove
- Duplicate
Zichtbaarheidsschaal instellen
- Set Layer CRS
Project-CRS van laag overnemen
Stijlen ‣
- Save as ...
- Save As Layer Definition File ...
Eigenschappen
Hernoemen
Additionally, according to layer position and selection
Naar hoogste niveau verplaatsen
Groep geselecteerd
Right mouse button menu for vector layers
- Zoom to Layer
- Show in overview
- Remove
- Duplicate
Zichtbaarheidsschaal instellen
- Set Layer CRS
Project-CRS van laag overnemen
Stijlen ‣
- Open Attribute Table
- Toggle Editing (not available for GRASS layers)
- Save As ...
- Save As Layer Definition Style
Query
- Show Feature Count
Eigenschappen
Hernoemen
Additionally, according to layer position and selection
Naar hoogste niveau verplaatsen
Groep geselecteerd
Right mouse button menu for layer groups
- Zoom to Group
- Remove
- Set Group CRS
Hernoemen
- Add Group
Het is mogelijk om meer dan één laag of groep tegelijkertijd te selecteren door de Ctrl -toets vast te houden tijdens het selecteren van lagen met de linker muisknop. U kunt dan in een keer alles wat u geselecteerd heeft verplaatsen naar een groep.
You may also delete more than one layer or group at once by selecting several layers with the Ctrl key and pressing Ctrl+D afterwards. This way, all selected layers or groups will be removed from the layers list.
Werken met de onafhankelijke volgorde van lagen in Legenda
There is a panel that allows you to define an independent drawing order for the map legend.
You can activate it in the menu Settings ‣ Panels ‣ Layer
order. This feature allows you to, for instance, order your layers in order of importance,
but still display them in the correct order (see figure_layer_order).
Checking the  Control rendering order box underneath the
list of layers will cause a revert to default behavior.
Control rendering order box underneath the
list of layers will cause a revert to default behavior.
Figure Layer Order:
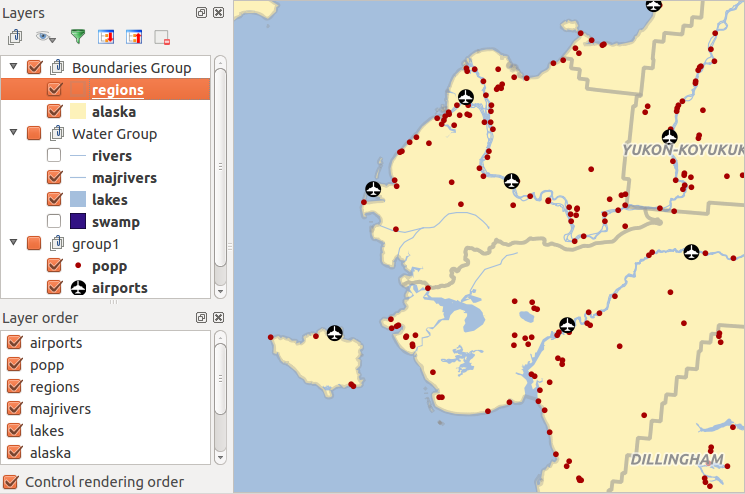
Define a legend independent layer order
Kaartvenster
This is the “business end” of QGIS — maps are displayed in this area! The map displayed in this window will depend on the vector and raster layers you have chosen to load (see sections that follow for more information on how to load layers). The map view can be panned, shifting the focus of the map display to another region, and it can be zoomed in and out. Various other operations can be performed on the map as described in the toolbar description above. The map view and the legend are tightly bound to each other — the maps in view reflect changes you make in the legend area.
Tip
Het kaartvenster in/uitzoomen met het muiswiel
Met het muiswiel kunt u in- en uitzoomen op de kaart. Plaats de muisaanwijzer in het kaartvenster en rol het muiswiel naar voren (van u af) om in te zoomen en achteruit (naar u toe) om uit te zoomen. De plaats van de muisaanwijzer is de plaats waar het in-/uitzoomen gebeurd. U kunt het gedrag van de muiswiel instellen in het menu Opties Extra ‣ Opties op de tab Kaartgereedschap.
Tip
Verschuiven van het kaartvenster met de pijltjestoetsen en de spatiebalk
U kunt de pijltjestoetsen gebruiken om het kaartbeeld te verschuiven. Plaats de muisaanwijzer in het kaartvenster en druk op de toets met de linkerpijl/rechterpijl om het kaartvenster naar west/oost te verschuiven of pijl omhoog/pijl omlaag om deze naar noord/zuid te verschuiven. Maar u kunt ook de spatiebalk gebruiken om het kaartvenster te verschuiven! Met ingedrukte spatiebalk kunt u met de muisaanwijzer het kaartvenster verschuiven in gewenste richting of klik op het muiswiel.
Statusbalk
The status bar shows you your current position in map coordinates (e.g., meters or decimal degrees) as the mouse pointer is moved across the map view. To the left of the coordinate display in the status bar is a small button that will toggle between showing coordinate position or the view extents of the map view as you pan and zoom in and out.
Next to the coordinate display you will find the scale display. It shows the scale of the map view. If you zoom in or out, QGIS shows you the current scale. There is a scale selector, which allows you to choose between predefined scales from 1:500 to 1:1000000.
Rechts naast de weergave van de schaal kunt u een huidige rotatie met de klok mee definiëren voor uw kaartweergave in graden.
A progress bar in the status bar shows the progress of rendering as each layer is drawn to the map view. In some cases, such as the gathering of statistics in raster layers, the progress bar will be used to show the status of lengthy operations.
If a new plugin or a plugin update is available, you will see a message at the
far left of the status bar. On the right side of the status bar, there is a small
checkbox which can be used to temporarily prevent layers being rendered to the
map view (see section Renderen below). The icon  immediately stops the current map rendering process.
To the right of the render functions, you find the EPSG code of the current project CRS and a projector icon. Clicking on this opens the projection properties for the current project.
Tip
Rekenen met de correcte schaal in het kaartvenster
When you start QGIS, the default units are degrees, and this means that QGIS will interpret any
coordinate in your layer as specified in degrees. To get correct scale values, you can
either change this setting to meters manually in the General tab
under Settings ‣ Project Properties, or you can select a
project CRS clicking on the  Current CRS: icon in the
lower right-hand corner of the status bar. In the last case, the units are set to what the
project projection specifies (e.g., ‘+units=m’).
Current CRS: icon in the
lower right-hand corner of the status bar. In the last case, the units are set to what the
project projection specifies (e.g., ‘+units=m’).