.
De Toolbox
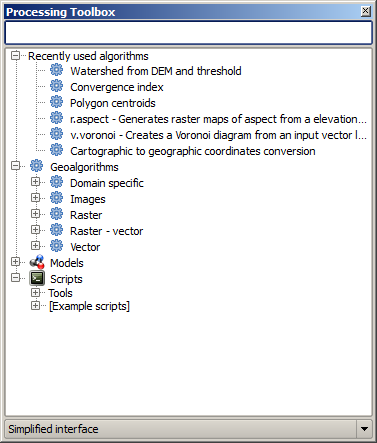
De Toolbox is het hoofdelement van de GUI van Processing en die welke u waarschijnlijk het meeste gaat gebruiken in uw dagelijkse werk. Het geeft de lijst met alle beschikbare algoritmen weer, gegroepeerd in verschillende blokken en het is het toegangspunt om ze uit te voeren, ofwel als één enkel proces of als een batch-proces wat verscheidene uitvoeringen behelst van hetzelfde algoritme op verschillende sets van invoer.
Figure Processing 5:
Processing Toolbox 
The toolbox contains all the available algorithms, divided into predefined groups. All these groups are found under a single tree entry named Geoalgorithms.
Additionally, two more entries are found, namely Models and Scripts. These include user-created algorithms, and they allow you to define your own workflows and processing tasks. We will devote a full section to them a bit later.
In het bovenste gedeelte van de Toolbox vindt u een tekstvak. U kunt een woord of een frase in dat tekstvak invoeren om het aantal algoritmen dat wordt weergegeven in de Toolbox te reduceren en het eenvoudiger te maken degene te vinden die u nodig heeft. Onthoud dat, terwijl u typt, het aantal algoritmen in de Toolbox wordt gereduceerd tot net diegenen die in hun namen de tekst bevatten die u heeft ingevoerd.
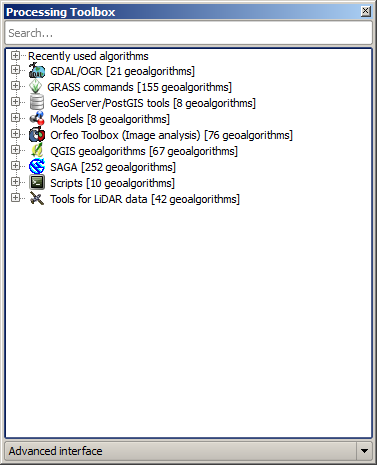
In the lower part, you will find a box that allows you to switch between the simplified algorithm list (the one explained above) and the advanced list. If you change to the advanced mode, the toolbox will look like this:
Figure Processing 6:
Processing Toolbox (advanced mode)
In the advanced view, each group represents a so-called ‘algorithm provider’, which is a set of algorithms coming from the same source, for instance, from a third-party application with geoprocessing capabilities. Some of these groups represent algorithms from third-party applications like SAGA, GRASS or R, while others contain algorithms directly coded as part of the processing plugin, not relying on any additional software.
This view is recommended to those users who have a certain knowledge of the applications that are backing the algorithms, since they will be shown with their original names and groups.
Also, some additional algorithms are available only in the advanced view, such as LiDAR tools and scripts based on the R statistical computing software, among others. Independent QGIS plugins that add new algorithms to the toolbox will only be shown in the advanced view.
In particular, the simplified view contains algorithms from the following providers:
- GRASS
- SAGA
- OTB
- Native QGIS algorithms
In the case of running QGIS under Windows, these algorithms are fully-functional in a fresh installation of QGIS, and they can be run without requiring any additional installation. Also, running them requires no prior knowledge of the external applications they use, making them more accesible for first-time users.
If you want to use an algorithm not provided by any of the above providers, switch to the advanced mode by selecting the corresponding option at the bottom of the toolbox.
Dubbelklik eenvoudigweg op de naam in de Toolbox om een algoritme uit te voeren.
Het dialoogvenster Algoritme
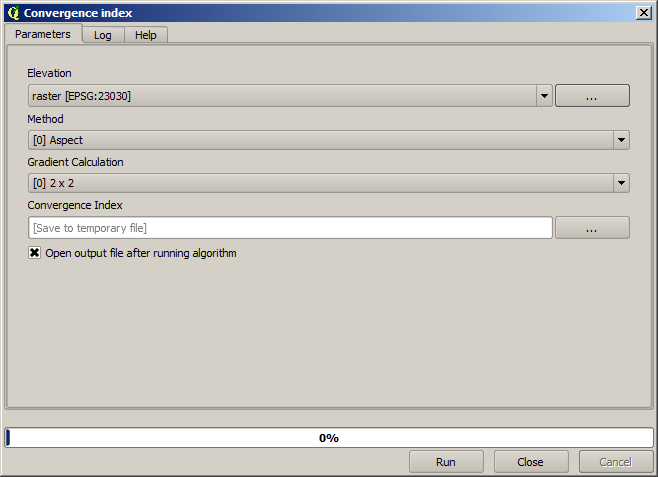
Once you double-click on the name of the algorithm that you want to execute, a dialog similar to that in the figure below is shown (in this case, the dialog corresponds to the SAGA ‘Convergence index’ algorithm).
Figure Processing 7:
Parameters Dialog
This dialog is used to set the input values that the algorithm needs to be executed. It shows a table where input values and configuration parameters are to be set. It of course has a different content, depending on the requirements of the algorithm to be executed, and is created automatically based on those requirements. On the left side, the name of the parameter is shown. On the right side, the value of the parameter can be set.
Hoewel het aantal en type parameters afhankelijk is van de karakteristieken van het algoritme, is de structuur voor alle ongeveer hetzelfde. De parameters in de tabel kunnen van een van de volgende types zijn.
A raster layer, to select from a list of all such layers available (currently opened) in QGIS. The selector contains as well a button on its right-hand side, to let you select filenames that represent layers currently not loaded in QGIS.
A vector layer, to select from a list of all vector layers available in QGIS. Layers not loaded in QGIS can be selected as well, as in the case of raster layers, but only if the algorithm does not require a table field selected from the attributes table of the layer. In that case, only opened layers can be selected, since they need to be open so as to retrieve the list of field names available.
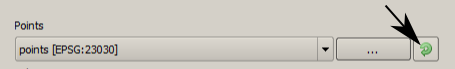
U zult een knop zien bij elke vectorlaag om te selecteren, zoals weergegeven in de afbeelding hieronder.
Figure Processing 8:
Vector iterator button
Als het algoritme er verscheidene van bevat, zult u in staat zijn er slechts één van te schakelen. Als de knop die correspondeert met een vectorinvoer wordt geschakeld, zal het algoritme iteratief worden uitgevoerd op elk van zijn objecten, in plaats van slechts één keer voor de gehele laag, net zoveel uitvoer producerend als het aantal keren dat het algoritme wordt uitgevoerd. Dit maakt het mogelijk het proces te automatiseren als alle objecten in een laag afzonderlijk moeten worden verwerkt.
- A table, to select from a list of all available in QGIS. Non-spatial tables are loaded into QGIS like vector layers, and in fact they are treated as such by the program. Currently, the list of available tables that you will see when executing an algorithm that needs one of them is restricted to tables coming from files in dBase (.dbf) or Comma-Separated Values (.csv) formats.
Een optie, om te kiezen uit een selectielijst met mogelijke opties.
- A numerical value, to be introduced in a text box. You will find a button by its side. Clicking on it, you will see a dialog that allows you to enter a mathematical expression, so you can use it as a handy calculator. Some useful variables related to data loaded into QGIS can be added to your expression, so you can select a value derived from any of these variables, such as the cell size of a layer or the northernmost coordinate of another one.
Figure Processing 9:
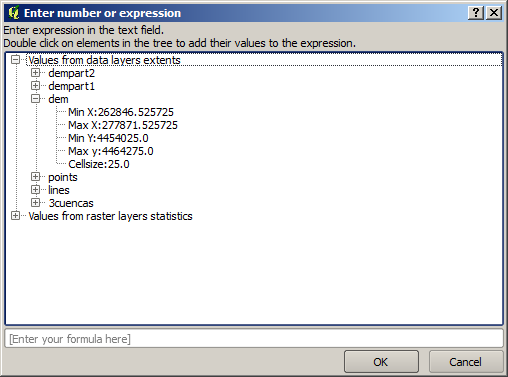
Number Selector
Een bereik, met min en max waarden die moeten worden ingevoerd in twee tekstvakken.
Een tekst-tekenreeks, om te worden ingevoerd in een tekstvak.
Een veld, om te kiezen uit de attributentabel van een vectorlaag of één enkele tabel, geselecteerd in een andere parameter.
Een coördinaten referentiesysteem. U kunt de code voor EPSG direct in het tekstvak typen, of die selecteren uit het dialoogvenster voor selectie van het CRS dat verschijnt wanneer u klikt op de knop aan de rechterkant.
Een bereik, dat moet worden ingevoerd met vier getallen die de grenzen xmin, xmax, ymin, ymax vertegenwoordigen. Klikken op de knop aan de rechterkant van de selectie voor de waarde laat een pop-upmenu verschijnen dat u twee opties geeft: selecteren van de waarde uit een laag oh het huidige bereik in het kaartvenster, of om het direct te slepen in het kaartvenster.
Figure Processing 10
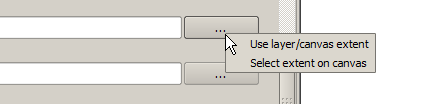
Extent selector
Als u de eerste optie selecteert, zult u een venster zoals het volgende zien.
Figure Processing 11
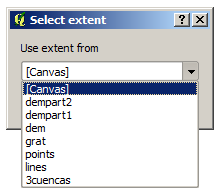
Extent List
Als u de tweede optie selecteert, zal het venster Parameters zichzelf verbergen, zodat u kunt klikken en slepen in het kaartvenster. Als u de geselecteerde rechthoek heeft gedefinieerd zal het dialoogvenster opnieuw verschijnen en de waarden bevatten in het tekstvak voor het bereik.
Figure Processing 12:
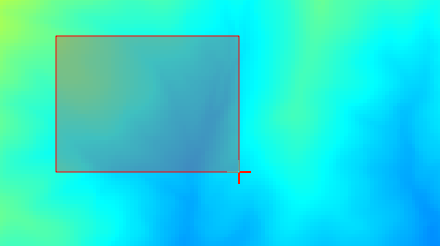
Extent Drag
A list of elements (whether raster layers, vector layers or tables), to select from the list of such layers available in QGIS. To make the selection, click on the small button on the left side of the corresponding row to see a dialog like the following one.
Figure Processing 13:
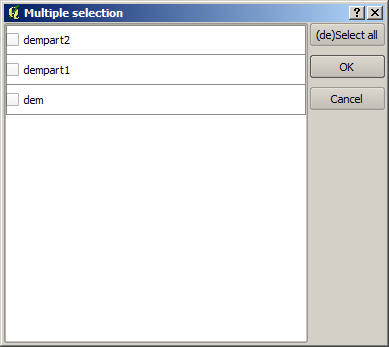
Multiple Selection
Een kleine tabel om te worden bewerkt door de gebruiker. Deze worden gebruikt om parameters te definiëren zoals tabellen voor opzoeken of samengevouwde kernen, naast andere.
Klik op de knop aan de rechterkant om de tabel te zien en de waarden ervan te bewerken.
Figure Processing 14:
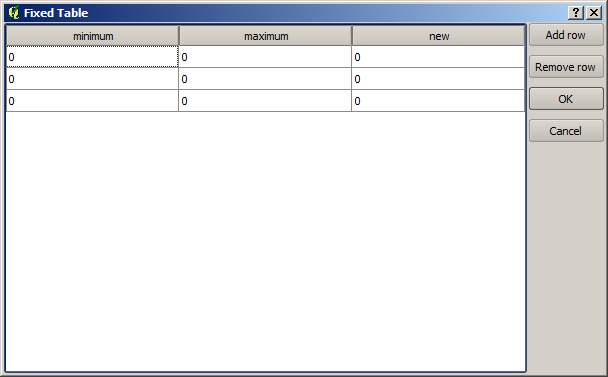
Fixed Table
Afhankelijk van het algoritme kan het aantal rijen, al dan niet, worden aangepast met de knoppen aan de rechterkant van het venster.
You will find a [Help] tab in the the parameters dialog. If a help file is available, it will be shown, giving you more information about the algorithm and detailed descriptions of what each parameter does. Unfortunately, most algorithms lack good documentation, but if you feel like contributing to the project, this would be a good place to start.
Een opmerking over projecties
Algorithms run from the processing framework — this is also true of most of the external applications whose algorithms are exposed through it. Do not perform any reprojection on input layers and assume that all of them are already in a common coordinate system and ready to be analized. Whenever you use more than one layer as input to an algorithm, whether vector or raster, it is up to you to make sure that they are all in the same coordinate system.
Note that, due to QGIS‘s on-the-fly reprojecting capabilities, although two layers might seem to overlap and match, that might not be true if their original coordinates are used without reprojecting them onto a common coordinate system. That reprojection should be done manually, and then the resulting files should be used as input to the algorithm. Also, note that the reprojection process can be performed with the algorithms that are available in the processing framework itself.
By default, the parameters dialog will show a description of the CRS of each layer along with its name, making it easy to select layers that share the same CRS to be used as input layers. If you do not want to see this additional information, you can disable this functionality in the processing configuration dialog, unchecking the Show CRS option.
Wanneer u probeert een algoritme uit te voeren met behulp van twee of meer lagen als invoer, waarvan de CRS-en niet overeenkomen, zal een dialoogvenster met een waarschuwing worden weergegeven.
U kunt nog steeds het algoritme uitvoeren, maar weet dat dat in de meeste gevallen verkeerde resultaten zal produceren, zoals lege lagen, omdat de invoerlagen elkaar niet overlappen.
Gegevensobjecten gegenereerd door algoritmen
Gegevensobjecten gegenereerd door een algoritme kunnen van één van de volgende typen zijn:
Een rasterlaag
Een vectorlaag
Een tabel
Een HTML-bestand (gebruikt voor tekst en grafische uitvoer)
These are all saved to disk, and the parameters table will contain a text box corresponding to each one of these outputs, where you can type the output channel to use for saving it. An output channel contains the information needed to save the resulting object somewhere. In the most usual case, you will save it to a file, but the architecture allows for any other way of storing it. For instance, a vector layer can be stored in a database or even uploaded to a remote server using a WFS-T service. Although solutions like these are not yet implemented, the processing framework is prepared to handle them, and we expect to add new kinds of output channels in a near feature.
To select an output channel, just click on the button on the right side of the text box. That will open a save file dialog, where you can select the desired file path. Supported file extensions are shown in the file format selector of the dialog, depending on the kind of output and the algorithm.
The format of the output is defined by the filename extension. The supported formats depend on what is supported by the algorithm itself. To select a format, just select the corresponding file extension (or add it, if you are directly typing the file path instead). If the extension of the file path you entered does not match any of the supported formats, a default extension (usually .dbf` for tables, .tif for raster layers and .shp for vector layers) will be appended to the file path, and the file format corresponding to that extension will be used to save the layer or table.
If you do not enter any filename, the result will be saved as a temporary file in the corresponding default file format, and it will be deleted once you exit QGIS (take care with that, in case you save your project and it contains temporary layers).
You can set a default folder for output data objects. Go to the configuration dialog (you can open it from the Processing menu), and in the General group, you will find a parameter named Output folder. This output folder is used as the default path in case you type just a filename with no path (i.e., myfile.shp) when executing an algorithm.
Bij het uitvoeren van een algoritme dat een vectorlaag in iteratieve modus gebruikt, wordt het ingevoerde bestandspad gebruikt als het basispad voor alle gegenereerde bestanden, die worden benoemd met behulp van de basisnaam en de toevoeging van een getal die de index van de iteratie vertegenwoordigt. De bestandsextensie (en indeling) wordt gebruikt alle op die manier gegenereerde bestanden.
Apart from raster layers and tables, algorithms also generate graphics and text as HTML files. These results are shown at the end of the algorithm execution in a new dialog. This dialog will keep the results produced by any algorithm during the current session, and can be shown at any time by selecting Processing ‣ Results viewer from the QGIS main menu.
Some external applications might have files (with no particular extension restrictions) as output, but they do not belong to any of the categories above. Those output files will not be processed by QGIS (opened or included into the current QGIS project), since most of the time they correspond to file formats or elements not supported by QGIS. This is, for instance, the case with LAS files used for LiDAR data. The files get created, but you won’t see anything new in your QGIS working session.
Voor alle andere typen van uitvoer zult u een tekstvak vinden dat u kunt gebruiken om het algoritme te vertellen om het bestand te laden als het eenmaal is gegenereerd door het algoritme of niet. Standaard worden alle bestanden geopend.
Optional outputs are not supported. That is, all outputs are created. However, you can uncheck the corresponding checkbox if you are not interested in a given output, which essentially makes it behave like an optional output (in other words, the layer is created anyway, but if you leave the text box empty, it will be saved to a temporary file and deleted once you exit QGIS).
Configureren van het framework Processing
Zoals al eerder verteld geeft het menu Opties toegang tot een nieuw dialoogvenster waar u kunt configureren hoe algoritmen werken. Parameters voor configuratie zijn gestructureerd in afzonderlijke blokken die u kunt selecteren aan de linkerkant van het dialoogvenster.
Along with the aforementioned Output folder entry, the General block contains parameters for setting the default rendering style for output layers (that is, layers generated by using algorithms from any of the framework GUI components). Just create the style you want using QGIS, save it to a file, and then enter the path to that file in the settings so the algorithms can use it. Whenever a layer is loaded by SEXTANTE and added to the QGIS canvas, it will be rendered with that style.
Stijlen voor weergave kunnen individueel worden geconfigureerd voor elk algoritme en elk van diens uitvoeren. Klik eenvoudigweg met rechts op de naam van het algoritme in de Toolbox en selecteer Weergave-stijlen voor uitvoer bewerken. U zult een dialoogvenster zien zoals hieronder wordt weergegeven.
Figure Processing 15:
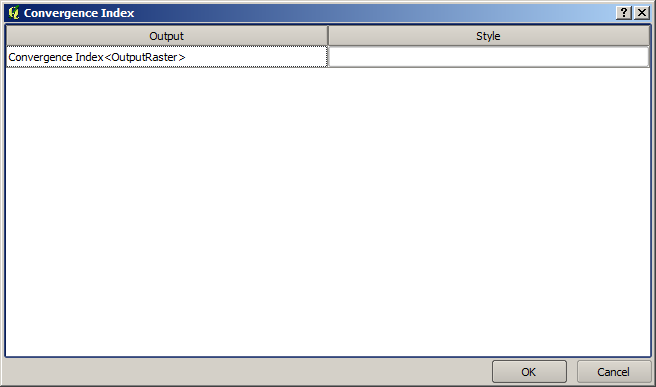
Rendering Styles
Selecteer het stijlbestand (.qml) dat u wilt toepassen voor elke uitvoer en druk op [OK].
Andere parameters voor configuratie in de groep Algemeen zijn hieronder vermeld:
Gebruik bestandsnaam als laagnaam. De naam van elke resulterende laag die wordt gemaakt door een algoritme wordt gedefinieerd dor het algoritme zelf. In sommige gevallen zou een vaste naam kunnen worden gebruikt, wat betekent dat dezelfde naam voor de uitvoer wordt gebruikt,ongeacht welke laag voor de invoer wordt gebruikt. In andere gevallen zou de naam afhankelijk kunnen zijn van de naam van de invoerlaag of enkele van de parameters die worden gebruikt om het algoritme uit te voeren. Als dit keuzevak is geselecteerd zal in plaats daarvan de naam uit de naam voor het uitvoerbestand worden genomen. Onthoud dat, wanneer de uitvoer wordt opgeslagen naar een tijdelijk bestand, de bestandsnaam van dit tijdelijke bestand gewoonlijk een lange en betekenisloze is, bedoeld om botsingen met reeds bestaand bestandsnamen te vermijden.
Alleen geselecteerde objecten gebruiken. Als deze optie is geselecteerd zullen wanneer een vectorlaag wordt gebruikt als invoer voor een algoritme, alleen de geselecteerde objecten worden gebruikt. Als de laag geen geselecteerde objecten heeft, zullen alle objecten worden gebruikt.
Vóór-uitvoering script en Na-uitvoering script. Deze parameters verwijzen naar de scripts die zijn geschreven met behulp van de functionaliteit Scripten in Processing, en worden uitgelegd in het gedeelte dat het scripten en de console behandelt.
Apart van het blok Algemeen in het dialoogvenster Opties, zult u ook een blok vinden voor de providers van algoritmen. Elk item in dit blok bevat een item Activate dat u kunt gebruiken om algoritmen te laten verschijnen in de Toolbox of niet. Ook hebben sommige providers van algoritmen hun eigen items voor configuratie, die we later zullen uitleggen bij het behandelen van bepaalde providers van algoritmen.