.
Algemeen gereedschap
Snelkoppelingen toetsenbord
QGIS provides default keyboard shortcuts for many features. You can find them in section Menubalk. Additionally, the menu option Settings ‣ Configure Shortcuts.. allows you to change the default keyboard shortcuts and to add new keyboard shortcuts to QGIS features.
Figure Shortcuts 1:
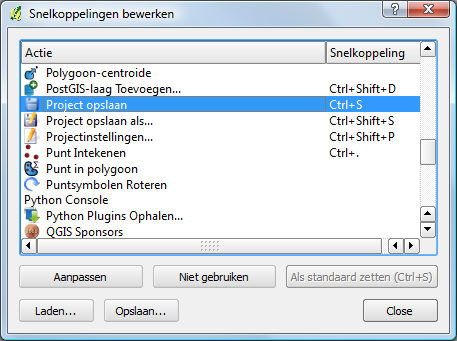
Define shortcut options  (Gnome)
Configuration is very simple. Just select a feature from the list and click on [Change], [Set none] or [Set default]. Once you have finished your configuration, you can save it as an XML file and load it to another QGIS installation.
Contextuele help
Wanneer u hulp nodig heeft over een specifiek onderwerp, kunt u in veel dialoogvensters/menu’s op de knop [Help] drukken. De knop Help in plug-ins die door derden zijn ontwikkeld, kunnen verwijzen naar speciaal daarvoor gemaakte webpagina’s.
Renderen
By default, QGIS renders all visible layers whenever the map canvas is refreshed. The events that trigger a refresh of the map canvas include:
Toevoegen van een laag
Verschuiven of in/uitzoomen
- Resizing the QGIS window
Het wijzigen van de zichtbaarheden van een laag of lagen
QGIS allows you to control the rendering process in a number of ways.
Schaalafhankelijk renderen
Met schaalafhankelijk tonen is het mogelijk om de minimum en maximum schalen in te stellen waarbij een laag zichtbaar zal zijn. Open het dialoogvenster Eigenschappen door te dubbelklikken op een laag in de legenda om schaalafhankelijk tonen in te stellen. Op de tab Algemeen kan men het keuzevak  Gebruik schaalafhankelijk tonen selecteren en vervolgens de minimum en maximum schaalwaarden invullen waarbinnen de laag zichtbaar zal zijn.
You can determine the scale values by first zooming to the level you want to use and noting the scale value in the QGIS status bar.
Controle over het renderen van de kaart
Map rendering can be controlled in the various ways, as described below.
Uitstellen van het renderen
To suspend rendering, click the Render checkbox in the
lower right corner of the status bar. When the Render
checkbox is not checked, QGIS does not redraw the canvas in response to any of
the events described in section Renderen. Examples of when you
might want to suspend rendering include:
Na het toevoegen van veel kaartbladen wilt u deze eerst van symbologie voorzien en de tekenvolgorde instellen
Na het toevoegen van een of meer grote lagen wilt u eerst instellen bij welke schalen deze getekend zal worden
Na het toevoegen van één of meer grote lagen, wilt u eerst inzoomen op een bepaald gebied voordat dit getekend wordt
Een combinatie van bovenstaande redenen
Het weer selecteren van Render zal onmiddellijk het opnieuw opbouwen van het kaartvenster starten.
Instellen optie Laag toevoegen
Er is ook de mogelijkheid om het kaartvenster niet opnieuw te tekenen na het toevoegen van nieuwe lagen. Het keuzevak dat de zichtbaarheid weergeeft van de nieuw toegevoegde laag, is dan niet geselecteerd. Kies, om deze optie in te stellen, de menuoptie Extra ‣ Opties ‣ en open de tab Rendering. Deselecteer het keuzevak Standaard zullen nieuw toegevoegde lagen aan de kaart direct worden afgebeeld. De zichtbaarheid van elke laag die hierna wordt toegevoegd, zal standaard uit staan in de legenda.
Het renderen stoppen
Druk op de ESC-toets om het tekenen van de kaart te stoppen. Dit zal het tekenen van de kaart onderbreken waarbij de kaart slechts gedeeltelijk getekend is. Het kan even duren voordat het tekenen stopt na het indrukken van de ESC-toets.
Notitie
Het is momenteel niet mogelijk om het renderen te stoppen - dit is tijdelijk uitgeschakeld in de op Qt4 gebouwde versie aangezien dit kon leiden tot problemen als het stoppen van de toepassing.
Updating the Map Display During Rendering
You can set an option to update the map display as features are drawn. By default, QGIS does not display any features for a layer until the entire layer has been rendered. To update the display as features are read from the datastore, choose menu option Settings ‣ Options and click on the Rendering tab. Set the feature count to an appropriate value to update the display during rendering. Setting a value of 0 disables update during drawing (this is the default). Setting a value too low will result in poor performance, as the map canvas is continually updated during the reading of the features. A suggested value to start with is 500.
Beïnvloeden van de kwaliteit van het renderen
To influence the rendering quality of the map, you have two options. Choose menu option Settings ‣ Options, click on the Rendering tab and select or deselect following checkboxes:
- Make lines appear less jagged at the expense of some
drawing performance
- Fix problems with incorrectly filled polygons
Het renderen versnellen
There are two settings that allow you to improve rendering speed. Open the QGIS options dialog using Settings ‣ Options, go to the Rendering tab and select or deselect the following checkboxes:
- Enable back buffer. This provides better graphics
performance at the cost of losing the possibility to cancel rendering and
incrementally draw features. If it is unchecked, you can set the
Number of features to draw before updating the display, otherwise
this option is inactive.
- Gebruik de cache voor het tekenen indien mogelijk om het hertekenen te versnellen
Meten
Measuring works within projected coordinate systems (e.g., UTM) and unprojected data. If the loaded map is defined with a geographic coordinate system (latitude/longitude), the results from line or area measurements will be incorrect. To fix this, you need to set an appropriate map coordinate system (see section Werken met projecties). All measuring modules also use the snapping settings from the digitizing module. This is useful, if you want to measure along lines or areas in vector layers.
To select a measuring tool, click on  and select the tool you want
to use.
and select the tool you want
to use.
Measure length, areas and angles
Measure Line: QGIS is able to measure real distances
between given points according to a defined ellipsoid. To configure this,
choose menu option Settings ‣ Options, click on the
Map tools tab and select the appropriate ellipsoid. There, you can
also define a rubberband color and your preferred measurement units (meters or
feet) and angle units (degrees, radians and gon). The tool then allows you to
click points on the map. Each segment length, as well as the total, shows up in
the measure window. To stop measuring, click your right mouse button.
Note that you can interactively change the measurement units in the measurement
dialog. It overrides the Preferred measurement units in the options.
There is an info section in the dialog that shows which CRS settings are being used
during measurement calculations.
Figure Measure 1:
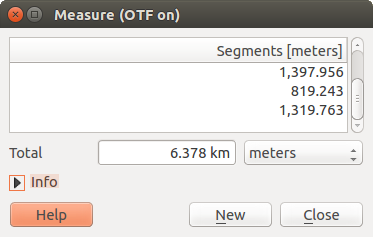
Measure Distance (Gnome)
 Measure Area: Areas can also be measured. In the
measure window, the accumulated area size appears. In addition, the measuring
tool will snap to the currently selected layer, provided that layer has its
snapping tolerance set (see section Het instellen van de toleranties voor snappen en Zoekradius). So, if you want
to measure exactly along a line feature, or around a polygon feature, first set
its snapping tolerance, then select the layer. Now, when using the measuring
tools, each mouse click (within the tolerance setting) will snap to that layer.
Measure Area: Areas can also be measured. In the
measure window, the accumulated area size appears. In addition, the measuring
tool will snap to the currently selected layer, provided that layer has its
snapping tolerance set (see section Het instellen van de toleranties voor snappen en Zoekradius). So, if you want
to measure exactly along a line feature, or around a polygon feature, first set
its snapping tolerance, then select the layer. Now, when using the measuring
tools, each mouse click (within the tolerance setting) will snap to that layer.
Figure Measure 2:
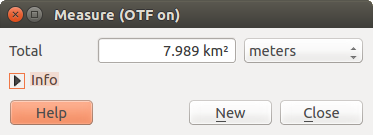
Measure Area (Gnome)
 Measure Angle: You can also measure angles. The
cursor becomes cross-shaped. Click to draw the first segment of the angle you
wish to measure, then move the cursor to draw the desired angle. The measure
is displayed in a pop-up dialog.
Measure Angle: You can also measure angles. The
cursor becomes cross-shaped. Click to draw the first segment of the angle you
wish to measure, then move the cursor to draw the desired angle. The measure
is displayed in a pop-up dialog.
Figure Measure 3:
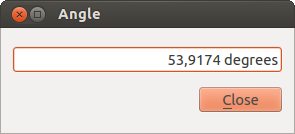
Measure Angle (Gnome)
Selecteren en deselecteren van objecten
The QGIS toolbar provides several tools to select features in the map canvas.
To select one or several features, just click on  and select your
tool:
and select your
tool:
- Select Single Feature
 Select Features by Rectangle
 Select Features by Polygon
 Select Features by Freehand
 Select Features by Radius
To deselect all selected features click on  Deselect
features from all layers.
Deselect
features from all layers.
 Select feature using an expression allow user
to select feature using expression dialog. See Expressies
chapter for some example.
Select feature using an expression allow user
to select feature using expression dialog. See Expressies
chapter for some example.
Users can save features selection into a New Memory Vector Layer or a New Vector Layer using Edit ‣ Paste Feature as ... and choose the mode you want.
Objecten identificeren
The Identify tool allows you to interact with the map canvas and get information on features
in a pop-up window. To identify features, use View ‣ Identify
features or press Ctrl + Shift + I, or click on the  Identify features icon in the toolbar.
If you click on several features, the Identify results dialog will list information about all the selected features. The first item is the number of the layer in the list of results, followed by the layer name. Then, its first child will be the name of a field with its value. The first field is the one selected in Properties ‣ Display. Finally, all information about the feature is displayed.
Dit venster kan worden aangepast om aangepaste velden te tonen, maar het zal standaard drie soorten informatie weergeven:
- Actions: Actions can be added to the identify feature windows. When clicking on the action label, action will be run. By default, only one action is added, to view feature form for editing.
- Derived: This information is calculated or derived from other information. You can find clicked coordinate, X and Y coordinates, area in map units and perimeter in map units for polygons, length in map units for lines and feature ids.
- Data attributes: This is the list of attribute fields from the data.
Figure Identify 1:
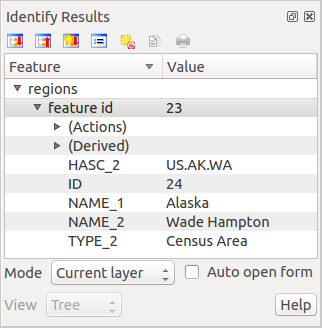
Identify feaures dialog (Gnome)
At the top of the window, you have five icons:
 Expand tree
 Collapse tree
 Default behaviour
 Copy attributes
 Print selected HTML response
At the bottom of the window, you have the Mode and View comboboxes. With the Mode combobox you can define the identify mode: ‘Current layer’, ‘Top down, stop at first’, ‘Top down’ and ‘Layer selection’. The View can be set as ‘Tree’, ‘Table’ and ‘Graph’.
The identify tool allows you to auto open a form. In this mode you can change the feautures attributes.
Andere functies kunnen worden gevonden in het contextmenu van het geïdentificeerde item. Vanuit het contextmenu kunt u bijvoorbeeld:
Het formulier Object bekijken
Naar object inzoomen
Kopieer object: Kopieer alle geometrie en attributen van het object
- Toggle feature selection: adds identified feature to selection
Attribuutwaarde kopiëren: Kopieert alleen de waarde van het attribuut waar u op klikt
- Copy feature attributes: Copy only attributes
Wis resultaat: Het scherm Identificatieresultaten wordt leeggemaakt
Wis accentueren: Verwijdert objecten die geaccentueerd waren op de kaart
Alles accentueren
Laag accentueren
Activeer laag: Kies een laag die moet worden geactiveerd
Laag-eigenschappen: Opent het menu Laag-eigenschappen
Alles uitklappen
Alles inklappen
Decoraties
The Decorations of QGIS include the Grid, the Copyright Label, the North Arrow and the Scale Bar. They are used to ‘decorate’ the map by adding cartographic elements.
Grid
 Grid geeft de mogelijkheid om een coördinatenraster en annotaties van coördinaten toe te voegen aan het kaartvenster.
Figure Decorations 1:
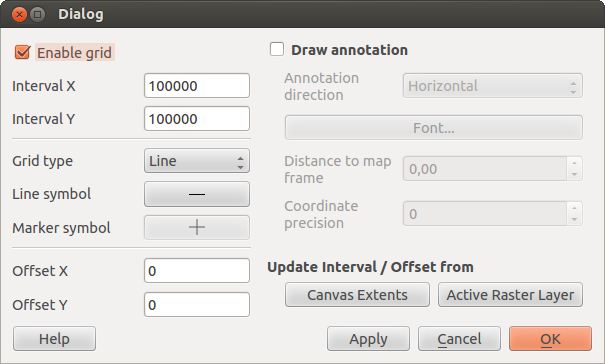
The Grid Dialog
Selecteer via het menu Beeld ‣ Decoraties ‣ Grid. Het dialoogvenster opent (zie figure_decorations_1).
Activeer het keuzevak
Grid activeren en stel de definities voor het raster in, overeenkomstig de geladen lagen in het kaartvenster.Activeer het keuzevak
Teken labels en stel de definities voor annotatie in overeenkomstig de lagen die geladen zijn in het kaartvenster.- Click [Apply] to verify that it looks as expected.
- Click [OK] to close the dialog.
Label Copyright
 Copyright label adds a copyright label using the text
you prefer to the map.
Copyright label adds a copyright label using the text
you prefer to the map.
Figure Decorations 2:
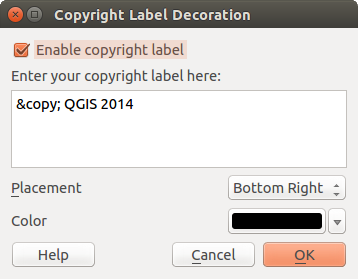
The Copyright Dialog
Selecteer in het menu Beeld ‣ Decoraties ‣ Copyrightlabel. Het dialoogvenster opent (zie figure_decorations_2).
Geef de tekst die geplaatst dient te worden op de kaart. U kunt daarbij HTML gebruiken zoals getoond in het voorbeeld.
- Choose the placement of the label from the Placement
 combo box.
 Zorg ervoor dat het keuzevak
Copyright Label tonen aangevinkt is.- Click [OK].
In the example above, which is the default, QGIS places a copyright symbol followed by the date in the lower right-hand corner of the map canvas.
Noordpijl
![]() North Arrow places a simple north arrow on the map canvas.
At present, there is only one style available. You can adjust the angle of the
arrow or let QGIS set the direction automatically. If you choose to let QGIS
determine the direction, it makes its best guess as to how the arrow should be
oriented. For placement of the arrow, you have four options, corresponding to
the four corners of the map canvas.
North Arrow places a simple north arrow on the map canvas.
At present, there is only one style available. You can adjust the angle of the
arrow or let QGIS set the direction automatically. If you choose to let QGIS
determine the direction, it makes its best guess as to how the arrow should be
oriented. For placement of the arrow, you have four options, corresponding to
the four corners of the map canvas.
Figure Decorations 3:
The North Arrow Dialog
Schaalbalk
 Scale Bar adds a simple scale bar to the map canvas. You
can control the style and placement, as well as the labeling of the bar.
Scale Bar adds a simple scale bar to the map canvas. You
can control the style and placement, as well as the labeling of the bar.
Figure Decorations 4:
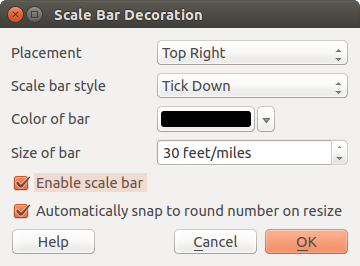
The Scale Bar Dialog
QGIS only supports displaying the scale in the same units as your map frame. So if the units of your layers are in meters, you can’t create a scale bar in feet. Likewise, if you are using decimal degrees, you can’t create a scale bar to display distance in meters.
Een schaalbalk toevoegen:
Selecteer via het menu Beeld ‣ Decoraties ‣ Schaalbalk. Het dialoogvenster opent (zie figure_decorations_4).
- Choose the placement from the Placement combo box.
- Choose the style from the Scale bar style
combo box.
- Select the color for the bar Color of bar
 or use
the default black color.
or use
the default black color. - Set the size of the bar and its label Size of bar
 .
. Zorg ervoor dat het keuzevak
Schaalbalk gebruiken is aangevinkt.- Optionally, check Automatically snap to round number
on resize.
- Click [OK].
Tip
Decoratie-instellingen
Wanneer u een project van QGIS opslaat, zullen de wijzigingen die u heeft gemaakt aan Grid, Noordpijl, Schaalbalk en Copyright mee worden opgeslagen in het projectbestand en teruggezet worden bij het openen van het project.
Gereedschappen voor annotatie
The  Text Annotation tool in the attribute
toolbar provides the possibility to place formatted text in a balloon on the
QGIS map canvas. Use the Text Annotation tool and click into the
map canvas.
Text Annotation tool in the attribute
toolbar provides the possibility to place formatted text in a balloon on the
QGIS map canvas. Use the Text Annotation tool and click into the
map canvas.
Figure annotation 1:
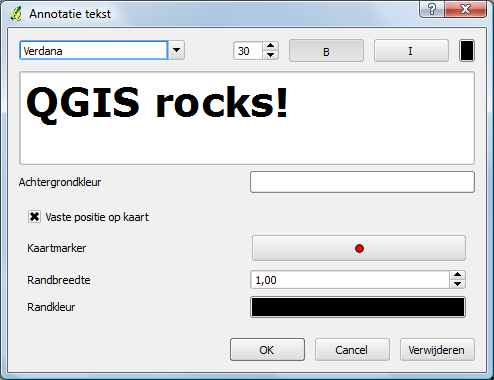
Annotation text dialog
Wanneer u dubbelklikt op de ballontekst heeft u verschillende mogelijkheden om deze aan te passen. Er is een tekstvak waar u de tekst mee kunt aanpassen. U kunt kiezen of de tekst verbonden is aan een kaartlocatie of dat deze steeds op dezelfde plaats blijft staan ook al verschuift u de kaart. U kunt het tekstitem verplaatsen door de markering op de kaart of de ballontekst naar een andere plek te slepen. De gebruikte pictogrammen zijn onderdeel van het thema GIS, maar worden standaard ook in de andere thema’s gebruikt.
The  Move Annotation tool allows you to move the
annotation on the map canvas.
Move Annotation tool allows you to move the
annotation on the map canvas.
HTML-annotaties
The  Html Annotation tools in the attribute
toolbar provides the possibility to place the content of an html file in a
balloon on the QGIS map canvas. Using the Html Annotation tool, click
into the map canvas and add the path to the html file into the dialog.
Html Annotation tools in the attribute
toolbar provides the possibility to place the content of an html file in a
balloon on the QGIS map canvas. Using the Html Annotation tool, click
into the map canvas and add the path to the html file into the dialog.
SVG-annotaties
The  SVG Annotation tool in the attribute toolbar
provides the possibility to place an SVG symbol in a balloon on the QGIS map
canvas. Using the SVG Annotation tool, click into the map canvas and
add the path to the SVG file into the dialog.
SVG Annotation tool in the attribute toolbar
provides the possibility to place an SVG symbol in a balloon on the QGIS map
canvas. Using the SVG Annotation tool, click into the map canvas and
add the path to the SVG file into the dialog.
Formulier-annotaties
Additionally, you can also create your own annotation forms. The
Form Annotation tool is useful to display
attributes of a vector layer in a customized Qt Designer form (see
figure_custom_annotation). This is similar to the designer forms for the
Identify features tool, but displayed in an annotation item.
Also see this video https://www.youtube.com/watch?v=0pDBuSbQ02o from
Tim Sutton for more information.
Figure annotation 2:
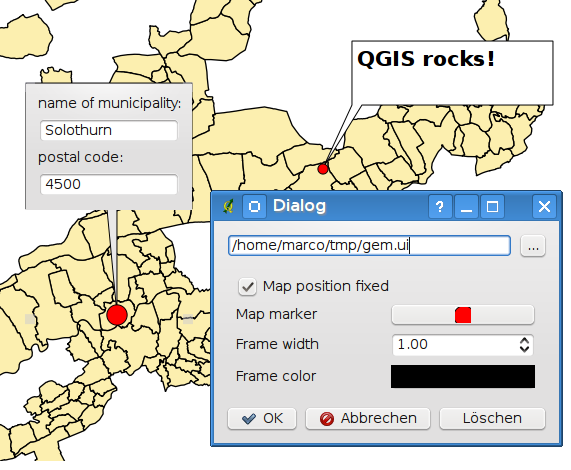
Customized qt designer annotation form
Notitie
Wanneer u de toetsencombinatie Ctrl+T gebruikt terwijl een gereedschap Annotatie actief is (annotatie verplaatsen, tekst-annotatie, formulier-annotatie), dan wisselt het tekstitem van zichtbaar naar onzichtbaar en andersom.
Favoriete plaatsen
Spatial Bookmarks allow you to “bookmark” a geographic location and return to it later.
Favoriete plaats maken
Een favoriete plaats maken:
Zoom in op een gebied naar keuze.
- Select the menu option View ‣ New Bookmark or press Ctrl-B.
Geef een beschrijvende naam waaronder u de Favoriete plaats op wilt slaan (tot 255 tekens).
- Press Enter to add the bookmark or [Delete] to remove the bookmark.
Men kan meerdere favorieten onder dezelfde naam opslaan.
Werken met Favoriete plaatsen
To use or manage bookmarks, select the menu option View ‣ Show Bookmarks. The Geospatial Bookmarks dialog allows you to zoom to or delete a bookmark. You cannot edit the bookmark name or coordinates.
Zooming to a Bookmark
From the Geospatial Bookmarks dialog, select the desired bookmark by clicking on it, then click [Zoom To]. You can also zoom to a bookmark by double-clicking on it.
Deleting a Bookmark
To delete a bookmark from the Geospatial Bookmarks dialog, click on it, then click [Delete]. Confirm your choice by clicking [Yes], or cancel the delete by clicking [No].
Import or export a bookmark
To share or transfer your bookmarks between computers you can use the Share pull down menu in the Geospatial Bookmarks dialog.
Projecten in een project
Wanneer u de inhoud van een ander project wilt opnemen in een project kunt u kiezen voor Kaartlagen ‣ Kaartlagen en groepen inbedden.
Lagen inbedden
Het volgende dialoogvenster maakt het inbedden van lagen vanuit een ander project mogelijk. Hier volgt een voorbeeld:
- Press
 to look for another project from the Alaska dataset.
 - Select the project file grassland. You can see the content of the project (see figure_embed_dialog).
- Press Ctrl and click on the layers grassland and regions. Press [OK]. The selected layers are embedded in the map legend and the map view now.
Figure Nesting 1:
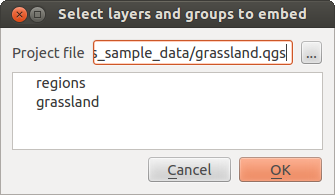
Select layers and groups to embed
Alhoewel u de ingebedde lagen kunt bewerken, kunt u eigenschappen als Stijl en Labels van deze lagen niet aanpassen.
Ingebedde lagen verwijderen
Right-click on the embedded layer and choose  Remove.