.
Ondersteunde gegevensindelingen
QGIS uses the OGR library to read and write vector data formats, including ESRI shapefiles, MapInfo and MicroStation file formats, AutoCAD DXF, PostGIS, SpatiaLite, Oracle Spatial and MSSQL Spatial databases, and many more. GRASS vector and PostgreSQL support is supplied by native QGIS data provider plugins. Vector data can also be loaded in read mode from zip and gzip archives into QGIS. As of the date of this document, 69 vector formats are supported by the OGR library (see OGR-SOFTWARE-SUITE in Verwijzingen naar literatuur en web). The complete list is available at http://www.gdal.org/ogr/ogr_formats.html.
Notitie
Not all of the listed formats may work in QGIS for various reasons. For example, some require external commercial libraries, or the GDAL/OGR installation of your OS may not have been built to support the format you want to use. Only those formats that have been well tested will appear in the list of file types when loading a vector into QGIS. Other untested formats can be loaded by selecting *.*.
Het werken met vectorgegevens voor GRASS is beschreven in Integratie van GRASS GIS.
This section describes how to work with several common formats: ESRI shapefiles, PostGIS layers, SpatiaLite layers, OpenStreetMap vectors, and Comma Separated data (CSV). Many of the features available in QGIS work the same, regardless of the vector data source. This is by design, and it includes the identify, select, labeling and attributes functions.
ESRI Shapefiles
The standard vector file format used in QGIS is the ESRI shapefile. Support is provided by the OGR Simple Feature Library (http://www.gdal.org/ogr/).
Een shapefile bestaat uit meerdere bestanden. De volgende drie zijn noodzakelijk:
.shp bestand dat de geometrieën van de objecten bevat
.dbf bestand dat de attribuutwaarden bevat in de indeling voor dBase
.shx het indexbestand
Shapefiles kunnen ook een bestand bevatten met de bestandsextensie .prj, het projectiebestand dat informatie over het gebruikte coördinatensysteem bevat. Alhoewel een projectiebestand erg handig is, is het niet noodzakelijk. Een shapefile gegevensset kan daarnaast nog meer bestanden bevatten. Voor verdere details, bekijk de technisch specificaties van ESRI op http://www.esri.com/library/whitepapers/pdfs/shapefile.pdf.
Loading a Shapefile
To load a shapefile, start QGIS and click on the  Add Vector Layer toolbar button, or simply press Ctrl+Shift+V.
This will bring up a new window (see figure_vector_1).
Add Vector Layer toolbar button, or simply press Ctrl+Shift+V.
This will bring up a new window (see figure_vector_1).
Figure Vector 1:
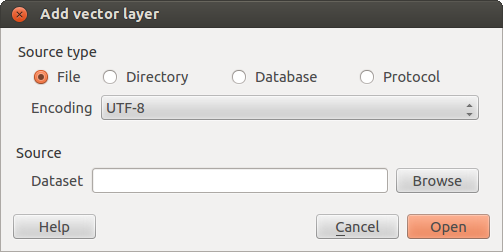
Add Vector Layer Dialog 
From the available options check  File. Click on
[Browse]. That will bring up a standard open file dialog
(see figure_vector_2), which allows you to navigate the file system and load a
shapefile or other supported data source. The selection box Filter
File. Click on
[Browse]. That will bring up a standard open file dialog
(see figure_vector_2), which allows you to navigate the file system and load a
shapefile or other supported data source. The selection box Filter
 allows you to preselect some OGR-supported file formats.
You can also select the encoding for the shapefile if desired.
Figure Vector 2:
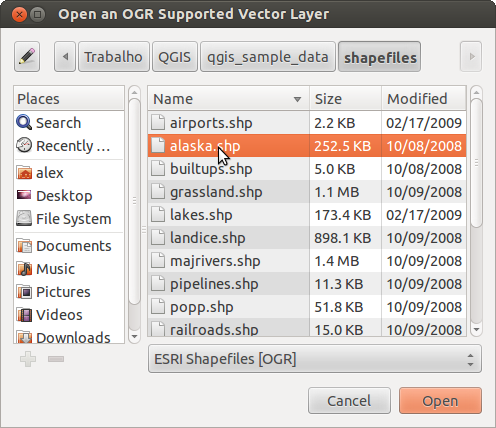
Open an OGR Supported Vector Layer Dialog
Selecting a shapefile from the list and clicking [Open] loads it into QGIS. Figure_vector_3 shows QGIS after loading the alaska.shp file.
Figure Vector 3:
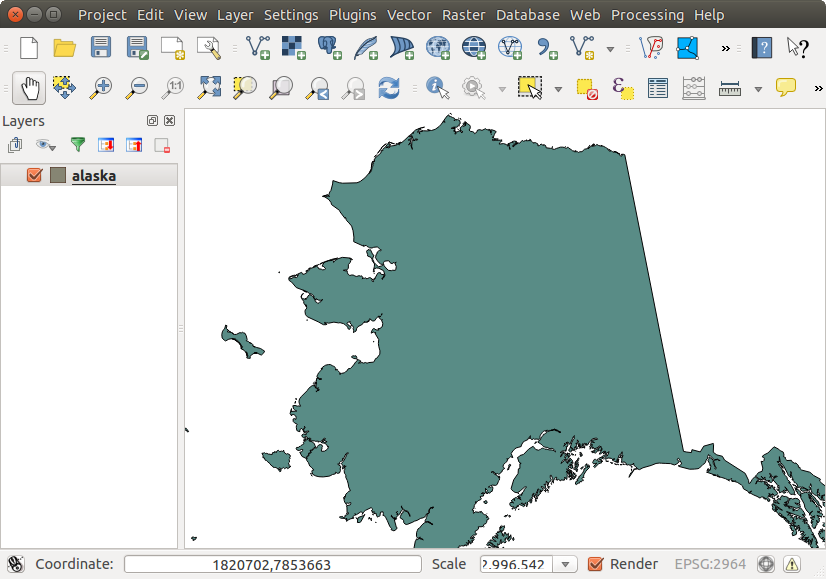
QGIS with Shapefile of Alaska loaded
Tip
Kleuren van kaartlagen
Wanneer u een kaartlaag toevoegt, zullen de objecten getoond worden in een willekeurige kleur. Wanneer u meer dan één kaartlaag toevoegt, zal elke kaartlaag een andere kleur krijgen.
Once a shapefile is loaded, you can zoom around it using the map navigation tools. To change the style of a layer, open the Layer Properties dialog by double clicking on the layer name or by right-clicking on the name in the legend and choosing Properties from the context menu. See section Menu Stijl for more information on setting symbology of vector layers.
Tip
Het laden van kaartlagen en projecten van exerne drives onder OS X
Onder OS X, worden de extern toegevoegde USB-sticks en externe harde schijven niet getoond onder Bestand ‣ Open project zoals men zou verwachten. We werken aan een meer OSX-eigen menu Openen/Opslaan om dit te verhelpen. U kunt echter, als tijdelijke oplossing, /Volumes invullen in het vak Bestandsnaam en op Enter drukken. Vervolgens kunt u nu ook de externe gekoppelde geheugeneenheden, zoals USB sticks, benaderen.
Improving Performance for Shapefiles
To improve the performance of drawing a shapefile, you can create a spatial index. A spatial index will improve the speed of both zooming and panning. Spatial indexes used by QGIS have a .qix extension.
Gebruik de volgende stappen om de index te maken:
- Load a shapefile by clicking on the Add Vector Layer
toolbar button or pressing Ctrl+Shift+V.
Open het menu Laag-eigenschappen door in de legenda te dubbelklikken op de naam van het shapefile of, na selectie in de legenda, met de rechter muisknop het snelmenu te openen en hierin Eigenschappen te kiezen.
In het tabblad Algemeen selecteer de knop [Ruimtelijke index maken].
Problem loading a shape .prj file
If you load a shapefile with a .prj file and QGIS is not able to read the coordinate reference system from that file, you will need to define the proper projection manually within the General tab of the Layer Properties dialog of the layer by clicking the [Specify...] button. This is due to the fact that .prj files often do not provide the complete projection parameters as used in QGIS and listed in the CRS dialog.
For the same reason, if you create a new shapefile with QGIS, two different projection files are created: a .prj file with limited projection parameters, compatible with ESRI software, and a .qpj file, providing the complete parameters of the used CRS. Whenever QGIS finds a .qpj file, it will be used instead of the .prj.
Loading a MapInfo Layer
To load a MapInfo layer, click on the
Add Vector Layer toolbar button; or type Ctrl+Shift+V, change the
file type filter Files of type : to
‘Mapinfo File [OGR] (*.mif *.tab *.MIF *.TAB)’ and select the MapInfo layer you
want to load.
Loading an ArcInfo Binary Coverage
To load an ArcInfo Binary Coverage, click on the
Add Vector Layer toolbar button or press
Ctrl+Shift+V to open the Add Vector Layer dialog. Select
Directory as Source type. Change the
file type filter Files of type to
‘Arc/Info Binary Coverage’. Navigate to the directory that contains the
coverage file, and select it.
Similarly, you can load directory-based vector files in the UK National Transfer Format, as well as the raw TIGER Format of the US Census Bureau.
Tekstgescheiden bestanden
Tabulaire gegevens is een veel en breed gebruikte indeling vanwege zijn eenvoud en leesbaarheid – gegevens kunnen zelfs in een tekstbewerkingsprogramma worden gelezen en bewerkt. Een tekstgescheiden bestand is een tabel met attributen waarin elke kolom wordt gescheiden door een gedefinieerd teken en elke regel wordt gescheiden door een regeleinde. De eerste regel bevat gewoonlijk de namen van de kolommen. Een veelgebruikt type tekstgescheiden bestand is een CSV (Comma Separated Values = komma gescheiden waarden), waarin elke kolom wordt gescheiden door een komma.
Dergelijke gegevensbestanden kunnen ook positionele informatie bevatten in twee belangrijke vormen:
Als puntcoördinaten in afzonderlijke kolommen
Als welbekende tekst (WKT) weergave van geometrie
QGIS allows you to load a delimited text file as a layer or ordinal table. But first check that the file meets the following requirements:
Het bestand moet een gescheiden kopregel met veldnamen hebben. Dit moet de eerste regel in het tekstbestand zijn.
De kopregel moet veld(en) bevatten met een definitie voor geometrie. Dit/Deze veld(en) mogen elke naam hebben.
De X- en Y-coördinaten (als de geometrie wordt gedefinieerd door coördinaten) moeten zijn gespecificeerd als getallen. Het coördinatensysteem is niet belangrijk.
As an example of a valid text file, we import the elevation point data file elevp.csv that comes with the QGIS sample dataset (see section Voorbeeldgegevens):
X;Y;ELEV
-300120;7689960;13
-654360;7562040;52
1640;7512840;3
[...]
Enkele opmerkingen over het tekstbestand:
Het voorbeeld tekstbestand gebruikt ; (puntkomma) als scheidingsteken. Elk teken kan gebruikt worden als scheidingsteken.
De eerst rij is de kopregel. Deze bevat de velden X, Y en ELEV.
Er zijn geen aanhalingstekens (") gebruikt voor de tekstvelden.
De X-coördinaten staan onder het veld X.
De Y-coördinaten staan onder het veld Y.
Het laden van een tekstgescheiden bestand
Click the toolbar icon  Add Delimited Text Layer in the
Manage layers toolbar to open the Create a Layer from a
Delimited Text File dialog, as shown in figure_delimited_text_1.
Add Delimited Text Layer in the
Manage layers toolbar to open the Create a Layer from a
Delimited Text File dialog, as shown in figure_delimited_text_1.
Figure Delimited Text 1:
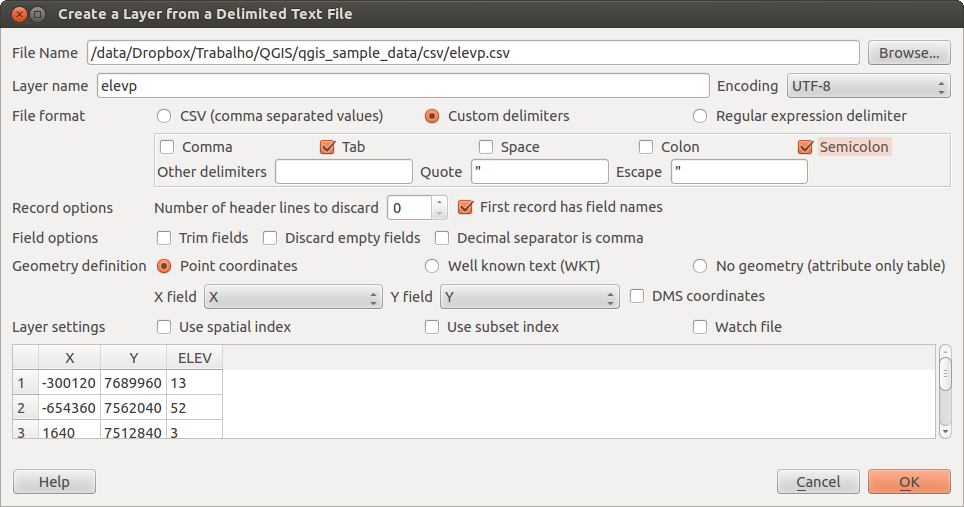
Delimited Text Dialog
First, select the file to import (e.g., qgis_sample_data/csv/elevp.csv)
by clicking on the [Browse] button. Once the file is selected, QGIS
attempts to parse the file with the most recently used delimiter. To enable QGIS to properly parse the
file, it is important to select the correct delimiter. You can specify a
delimiter by activating Custom delimiters, or by activating
Regular expression delimiter and entering
text into the Expression field. For example, to
change the delimiter to tab, use \t (this is a regular expression for the
tab character).
Once the file is parsed, set Geometry definition to
Point coordinates and choose the X and Y
fields from the dropdown lists. If the coordinates are defined as
degrees/minutes/seconds, activate the  DMS coordinates
checkbox.
DMS coordinates
checkbox.
Finally, enter a layer name (e.g., elevp), as shown in figure_delimited_text_1. To add the layer to the map, click [OK]. The delimited text file now behaves as any other map layer in QGIS.
Men kan de spaties voor en achter een veld verwijderen door het keuzevak Verwijder spaties voor/na velden. Men kan Sla lege velden over voor elk record gebruiken. Men kan aangeven dat de komma het decimale scheidingsteken is door het keuzevak Decimale scheidingsteken is de komma te activeren, anders is de punt het decimale scheidingsteken.
If spatial information is represented by WKT, activate the
Well Known Text option and select the field with the WKT definition for
point, line or polygon objects. If the file contains non-spatial data, activate
No geometry (attribute only table) and it will be
loaded as an ordinal table.
Additionaly, you can enable:
- Ruimtelijke index gebruiken om de uitvoering van de weergave te verbeteren en objecten ruimtelijk te selecteren.
- Gebruik een subset index.
- Watch file to watch for changes to the file by other
applications while QGIS is running.
Gegevens van OpenStreetMap
In recent years, the OpenStreetMap project has gained popularity because in many countries no free geodata such as digital road maps are available. The objective of the OSM project is to create a free editable map of the world from GPS data, aerial photography or local knowledge. To support this objective, QGIS provides suppport for OSM data.
Het laden van vectorgegevens van OpenStreetMap
QGIS integrates OpenStreetMap import as a core functionality.
Open, om verbinding te maken met de OSM server en gegevens te downloaden, het menu Vector ‣ OpenStreetMap ‣ Gegevens downloaden. Deze stap kan worden overgeslagen als u al een .osm XML-bestand hebt verkregen via JOSM, de Overpass API of via een andere bron.
Het menu Vector ‣ OpenStreetMap ‣ Importeer topologie van XML zal uw .osm-bestand omzetten naar een database van SpatiaLite en daarmee verbinding maken.
- The menu Vector ‣ Openstreetmap ‣ Export topology to
SpatiaLite then allows you to open the database connection, select the type
of data you want (points, lines, or polygons) and choose tags to import.
This creates a SpatiaLite geometry layer that you can add to your
project by clicking on the
 Add SpatiaLite Layer toolbar button or by selecting the
Add SpatiaLite Layer... option
from the Layer menu (see section SpatiaLite-kaartlagen).
Add SpatiaLite Layer toolbar button or by selecting the
Add SpatiaLite Layer... option
from the Layer menu (see section SpatiaLite-kaartlagen).
PostGIS-lagen
PostGIS layers are stored in a PostgreSQL database. The advantages of PostGIS are the spatial indexing, filtering and query capabilities it provides. Using PostGIS, vector functions such as select and identify work more accurately than they do with OGR layers in QGIS.
Een opgeslagen verbinding maken
 The first time you use a PostGIS data source, you must
create a connection to the PostgreSQL database that contains the data. Begin by
clicking on the Add PostGIS Layer toolbar
button, selecting the Add PostGIS Layer...
option from the Layer menu, or typing Ctrl+Shift+D. You
can also open the Add Vector Layer dialog and select
Database. The Add PostGIS Table(s)
dialog will be displayed. To access the connection manager, click on the
[New] button to display the Create a New PostGIS Connection
dialog. The parameters required for a connection are:
The first time you use a PostGIS data source, you must
create a connection to the PostgreSQL database that contains the data. Begin by
clicking on the Add PostGIS Layer toolbar
button, selecting the Add PostGIS Layer...
option from the Layer menu, or typing Ctrl+Shift+D. You
can also open the Add Vector Layer dialog and select
Database. The Add PostGIS Table(s)
dialog will be displayed. To access the connection manager, click on the
[New] button to display the Create a New PostGIS Connection
dialog. The parameters required for a connection are:
Naam: Een naam voor deze verbinding. Mag gelijk zijn aan Database.
Service: Service-parameter die gebruikt kan worden als alternatief voor Host/Poort (en eventueel ook Database). Dit kan gedefinieerd worden in pg_service.conf.
- Host: Name of the database host. This must be a resolvable host name such as would be used to open a telnet connection or ping the host. If the database is on the same computer as QGIS, simply enter ‘localhost’ here.
Poort: Poortnummer waar de database van PostgreSQL naar luistert. De standaardpoort is 5432.
Database: Naam van de database.
- SSL mode: How the SSL connection will be negotiated with the server. Note
that massive speedups in PostGIS layer rendering can be achieved by disabling
SSL in the connection editor. The following options are available:
Uitschakelen: alleen verbinden zonder SSL-versleuteling
Toestaan: Probeer een verbinding zonder SSL-versleuteling, als dat mislukt probeer dan met SSL.
Voorkeur (=standaard): Probeer een verbinding met SSL-versleuteling, als dat mislukt probeer dan een verbinding zonder SSL.
Vereist: Alleen verbinden met SSL-versleuteling.
Gebruikersnaam: Gebruikersnaam om toegang te krijgen tot de database.
Wachtwoord: Wachtwoord dat hoort bij Gebruikersnaam om toegang te krijgen tot de database.
Optioneel kunnen de volgende aanvinkvakjes worden geactiveerd:
- Gebruikersnaam opslaan
- Wachtwoord opslaan
- Alleen in de geometrie-kolommen kijken
- Niet het type geometrie bepalen voor onbeperkte kolommen (GEOMETRY)
- Alleen in het ‘publieke’-schema kijken
- Ook tabellen zonder geometrie tonen
- Gebruik ’estimated table statistics’
Wanneer alle veldparameters en opties zijn ingesteld, kunt u de verbinding testen met de knop [Test verbinding].
Laden van een PostGIS-laag
Once you have one or more connections defined, you can
load layers from the PostgreSQL database. Of course, this requires having data in
PostgreSQL. See section Het importeren van gegevens in PostgreSQL for a discussion on
importing data into the database.
Voer de volgende stappen uit om een laag te laden vanuit PostGIS:
- If the Add PostGIS layers dialog is not already open,
selecting the Add PostGIS Layer...
option from the Layer menu or typing Ctrl+Shift+D
opens the dialog.
Kies een aangemaakte verbinding vanuit de keuzelijst en druk op [Verbinden].
Selecteer of deselecteer het keuzevak
Ook tabellen zonder geometrie tonenOptioneel kunt u het keuzevak
Zoek opties selecteren om een selectie te maken van objecten die geladen dienen te worden of gebruik de knop [Filter instellen] om het venster te openen waarmee u een Filter kunt instellen middels een zoekopdracht.Zoek naar de laag/lagen die u wilt laden uit de lijst van beschikbare tabellen met gegevens.
Selecteer deze door er op te klikken. U kunt meerdere lagen selecteren door de Shift-toets in te drukken tijdens het klikken. Zie Querybouwer voor meer informatie over hoe de PostgreSQL Querybouwer te gebruiken om de laag verder te definiëren.
Klik op de knop [Toevoegen] om de laag toe te voegen aan de legenda en het kaartbeeld.
Tip
PostGIS-lagen
Normally, a PostGIS layer is defined by an entry in the geometry_columns table. From version 0.9.0 on, QGIS can load layers that do not have an entry in the geometry_columns table. This includes both tables and views. Defining a spatial view provides a powerful means to visualize your data. Refer to your PostgreSQL manual for information on creating views.
Enkele details over PostgreSQL-lagen
This section contains some details on how QGIS accesses PostgreSQL layers. Most of the time, QGIS should simply provide you with a list of database tables that can be loaded, and it will load them on request. However, if you have trouble loading a PostgreSQL table into QGIS, the information below may help you understand any QGIS messages and give you direction on changing the PostgreSQL table or view definition to allow QGIS to load it.
QGIS requires that PostgreSQL layers contain a column that can be used as a unique key for the layer. For tables, this usually means that the table needs a primary key, or a column with a unique constraint on it. In QGIS, this column needs to be of type int4 (an integer of size 4 bytes). Alternatively, the ctid column can be used as primary key. If a table lacks these items, the oid column will be used instead. Performance will be improved if the column is indexed (note that primary keys are automatically indexed in PostgreSQL).
If the PostgreSQL layer is a view, the same requirement exists, but views do not have primary keys or columns with unique constraints on them. You have to define a primary key field (has to be integer) in the QGIS dialog before you can load the view. If a suitable column does not exist in the view, QGIS will not load the layer. If this occurs, the solution is to alter the view so that it does include a suitable column (a type of integer and either a primary key or with a unique constraint, preferably indexed).
QGIS offers a checkbox Select at id that is activated by default. This option gets the ids without the attributes which is faster in most cases. It can make sense to disable this option when you use expensive views.
Tip
Back-up van database van PostGIS met door QGIS opgeslagen lagen
If you want to make a backup of your PostGIS database using the pg_dump and pg_restore commands the default layer styles as saved by QGIS are failing to restore afterwards. You need to set the XML option to DOCUMENT and the restore will work.
Het importeren van gegevens in PostgreSQL
Data can be imported into PostgreSQL/PostGIS using several tools, including the SPIT plugin and the command line tools shp2pgsql and ogr2ogr.
DB Manager
QGIS comes with a core plugin named  DB Manager. It can
be used to load shapefiles and other data formats, and it includes support for
schemas. See section Plug-in DB Manager for more information.
DB Manager. It can
be used to load shapefiles and other data formats, and it includes support for
schemas. See section Plug-in DB Manager for more information.
shp2pgsql
PostGIS bevat een stuk gereedschap genaamd shp2pgsql dat gebruikt kan worden om shapefiles te laden in een database van PostGIS. Gebruik de volgende opdracht om bijvoorbeeld een shapefile met de naam lakes.shp te laden in een database van PostgreSQL, genaamd gis_data:
shp2pgsql -s 2964 lakes.shp lakes_new | psql gis_data
Dit maakt een nieuwe tabel aan, genaamd lakes_new, in de database gis_data. De nieuwe tabel zal een ruimtelijke referentie ID (SRID) bevatten van 2964. Zie Werken met projecties voor meer informatie over Ruimtelijke Referentie Systemen en projecties.
Tip
Exporteren van gegevens uit PostGIS
Net zoals de importeerfunctie shp2pgsql is er ook een functie waarmee je PostGIS tabellen kunt exporteren naar shapefile: pgsql2shp. Deze functies vormen een standaard onderdeel van een distributie van PostGIS.
ogr2ogr
Naast shp2pgsql en DB Manager is er nog een manier om geografische gegevens in PostGIS in te lezen: ogr2ogr. Dit is een onderdeel van GDAL.
Geef de volgende opdracht om een shapefile te importeren in PostGIS:
ogr2ogr -f "PostgreSQL" PG:"dbname=postgis host=myhost.de user=postgres
password=topsecret" alaska.shp
Dit zal het shapefile alaska.shp importeren in de PostGIS-database postgis als gebruiker postgres met het wachtwoord topsecret op host server myhost.de.
Onthoud dat OGR moet gebouwd zijn met PostgreSQL om ondersteuning te kunnen geven aan PostGIS. U kunt dit controleren m.b.v. volgende opdracht (in )
ogrinfo --formats | grep -i post
Wanneer u de opdracht van PostgreSQL COPY wilt gebruiken in plaats van de standaard opdracht INSERT INTO kunt u dat doen door de volgende omgevingsvariabele in te stellen (tenminste beschikbaar op en  ):
):
export PG_USE_COPY=YES
ogr2ogr maakt geen ruimtelijke indexen aan zoals shp2pgsl dat wel doet. U dient ze handmatig te maken met de normale opdracht voor SQL CREATE INDEX (zoals beschreven in het volgende gedeelte Verbeteren van de uitvoering).
Verbeteren van de uitvoering
Retrieving features from a PostgreSQL database can be time-consuming, especially over a network. You can improve the drawing performance of PostgreSQL layers by ensuring that a PostGIS spatial index exists on each layer in the database. PostGIS supports creation of a GiST (Generalized Search Tree) index to speed up spatial searches of the data (GiST index information is taken from the PostGIS documentation available at http://postgis.refractions.net).
De opdracht voor het aanmaken van een GiST index is:
CREATE INDEX [indexname] ON [tablename]
  USING GIST ( [geometryfield] GIST_GEOMETRY_OPS );
Voor grote tabellen kan het aanmaken van een index veel tijd kosten. Wanneer de index is aangemaakt dient deze gevolgd te worden door de opdracht VACUUM ANALYZE. Zie de PostGIS documentatie (POSTGIS-PROJECT Verwijzingen naar literatuur en web) voor meer informatie.
Hier volgt een voorbeeld hoe je een GiST index kunt aanmaken:
gsherman@madison:~/current$ psql gis_data
Welcome to psql 8.3.0, the PostgreSQL interactive terminal.

Type:  \copyright for distribution terms
       \h for help with SQL commands
       \? for help with psql commands
       \g or terminate with semicolon to execute query
       \q to quit

gis_data=# CREATE INDEX sidx_alaska_lakes ON alaska_lakes
gis_data-# USING GIST (the_geom GIST_GEOMETRY_OPS);
CREATE INDEX
gis_data=# VACUUM ANALYZE alaska_lakes;
VACUUM
gis_data=# \q
gsherman@madison:~/current$
Vectorlagen die de 180° lengtegraad overschrijden
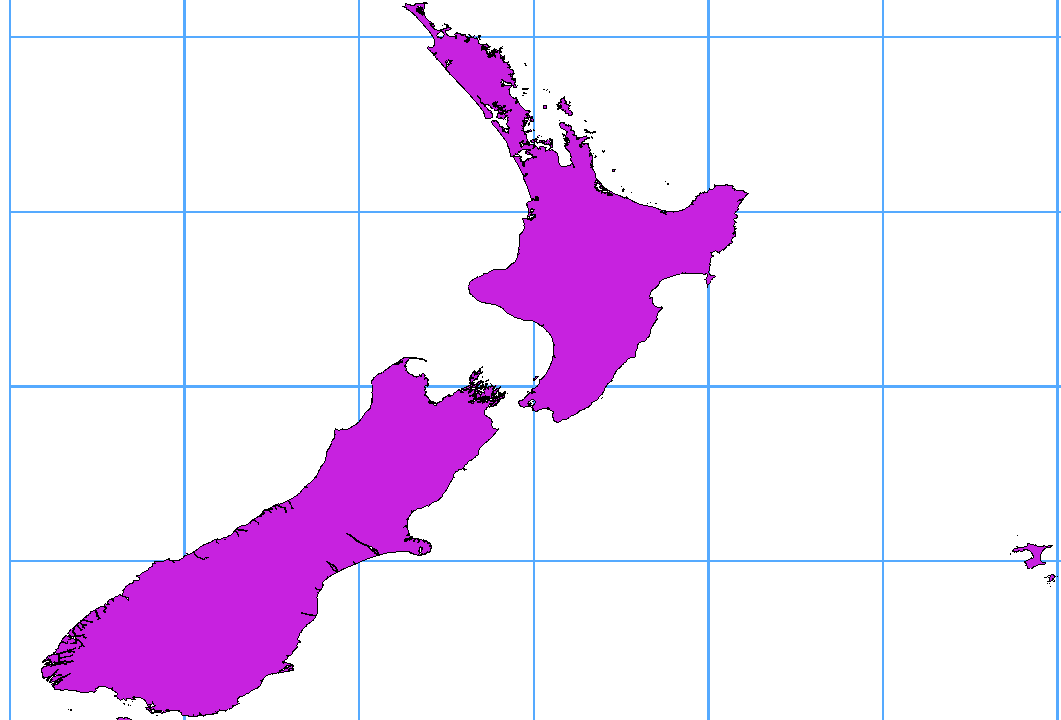
Many GIS packages don’t wrap vector maps with a geographic reference system (lat/lon) crossing the 180 degrees longitude line (http://postgis.refractions.net/documentation/manual-2.0/ST_Shift_Longitude.html). As result, if we open such a map in QGIS, we will see two far, distinct locations, that should appear near each other. In Figure_vector_4, the tiny point on the far left of the map canvas (Chatham Islands) should be within the grid, to the right of the New Zealand main islands.
Figure Vector 4:
Map in lat/lon crossing the 180° longitude line
Een oplossing is om de lengtegraden te transformeren met behulp van PostGIS, en de functie ST_Shift_Longitude. Deze functie leest elk punt/vertex in elke component van elk object in de geometrie en als de lengtegraad < 0° is, telt deze er 360° bij op. Het resultaat zal een versie 0° - 360° zijn van de gegevens die afgedrukt worden op een 180° gecentreerde kaart.
Figure Vector 5:
Het overschrijden van de 180° lengtegraad met het toepassen van de ST_Shift_Longitude functie
Gebruik
Importeer gegevens in PostGIS (Het importeren van gegevens in PostgreSQL), bijvoorbeeld door gebruik te maken van de plug-in DB Manager.
Geef de volgende opdracht op de opdrachtregel voor SQL van PostGIS (dit is een voorbeeld waar “TABEL” de echte naam is van uw tabel in PostGIS): gis_data=# update TABEL set the_geom=ST_Shift_Longitude(the_geom);
Als alles goed ging, zou u nu een bevestiging moeten ontvangen van het aantal objecten die bijgewerkt zijn. Daarna kan deze tabel geladen worden en ziet u het verschil (Figure_vector_5).
SpatiaLite-kaartlagen
The first time you load data from a SpatiaLite
database, begin by clicking on the
Add SpatiaLite Layer toolbar button, or by selecting the
Add SpatiaLite Layer... option
from the Layer menu, or by typing Ctrl+Shift+L.
This will bring up a window that will allow you either to connect to a
SpatiaLite database already known to QGIS, which you can choose from the
drop-down menu, or to define a new connection to a new database. To define a
new connection, click on [New] and use the file browser to point to
your SpatiaLite database, which is a file with a .sqlite extension.
Wanneer u een vectorlaag wilt opslaan in de indeling voor SpatiaLite kunt u dit doen door een vectorlaag in de legenda te selecteren en dan met de rechter muisknop het contextmenu te openen en daarin Opslaan als... te selecteren. Geef een naam voor de aan te maken database, geef ‘Spatialite’ als indeling en het CRS (Coördinaten Referentie Systeem). U kunt ook ‘SQLite’ als indeling selecteren en de opdracht SPATIALITE=YES in het veld OGR data source creation option opgeven. OGR weet dan dat het een database voor SpatiaLite moet maken. Zie ook http://www.gdal.org/ogr/drv_sqlite.html.
QGIS also supports editable views in SpatiaLite.
Het maken van een nieuwe SpatiaLite kaartlaag
Wanneer u een nieuwe SpatiaLite laag wilt maken, ga naar Nieuwe Spatialite-laag maken.
Tip
SpatiaLite data management Plugins
For SpatiaLite data management, you can also use several Python plugins: QSpatiaLite, SpatiaLite Manager or DB Manager (core plugin, recommended). If necessary, they can be downloaded and installed with the Plugin Installer.
MSSQL Spatial-lagen
 QGIS also provides native MS SQL 2008 support. The first
time you load MSSQL Spatial data, begin by clicking on the
Add MSSQL Spatial Layer toolbar button or by
selecting the Add MSSQL Spatial Layer...
option from the Layer menu, or by typing Ctrl+Shift+M.
QGIS also provides native MS SQL 2008 support. The first
time you load MSSQL Spatial data, begin by clicking on the
Add MSSQL Spatial Layer toolbar button or by
selecting the Add MSSQL Spatial Layer...
option from the Layer menu, or by typing Ctrl+Shift+M.
Oracle Spatial-lagen
The spatial features in Oracle Spatial aid users in managing geographic and location data in a native type within an Oracle database. QGIS now has support for such layers.
Een opgeslagen verbinding maken
 The first time you use an Oracle Spatial data source,
you must create a connection to the database that contains the data. Begin by
clicking on the Add Orcale Spatial Layer toolbar
button, selecting the Add Orcale
Spatial Layer... option from the Layer menu, or typing
Ctrl+Shift+O. To access the connection manager, click on the [New]
button to display the Create a New Oracle Spatial Connection dialog.
The parameters required for a connection are:
The first time you use an Oracle Spatial data source,
you must create a connection to the database that contains the data. Begin by
clicking on the Add Orcale Spatial Layer toolbar
button, selecting the Add Orcale
Spatial Layer... option from the Layer menu, or typing
Ctrl+Shift+O. To access the connection manager, click on the [New]
button to display the Create a New Oracle Spatial Connection dialog.
The parameters required for a connection are:
Naam: Een naam voor deze verbinding. Mag gelijk zijn aan Database.
Database SID of SERVICE_NAME van de Oracle instantie.
- Host: Name of the database host. This must be a resolvable host name such as would be used to open a telnet connection or ping the host. If the database is on the same computer as QGIS, simply enter ‘localhost’ here.
Poort: Poortnummer waar de server van de database van Oracle naar luistert. De standaard poort is 1521.
Gebruikersnaam: Gebruikersnaam om toegang te krijgen tot de database.
Wachtwoord: Wachtwoord dat hoort bij Gebruikersnaam om toegang te krijgen tot de database.
Optioneel kunnen de volgende keuzevakjes worden geactiveerd:
- Gebruikersnaam opslaan Geef aan of de gebruikersnaam van de verbinding naar de database moet worden opgeslagen.
- Wachtwoord opslaan Geeft aan of het wachtwoord van de verbinding naar de database moet worden opgeslagen.
- Kijk alleen in de metadata tabel. Dit beperkt de tabellen tot die aanwezig in de view all_sdo_geom_metadata. Dit kan het tonen van tabellen voor selectie aanzienlijk versnellen.
- Alleen zoeken naar tabellen van de gebruiker. Beperk de zoekopdracht tot alleen die ruimtelijke tabellen waar de gebruiker eigenaar van is.
- Ook tabellen zonder geometrie tonen Geeft aan dat ook tabellen zonder geometrie standaard in de lijst getoond worden.
- Gebruik geschatte tabelstatistieken voor de laag metadata Wanneer een laag wordt aangemaakt wordt er ook verschillende metadata aangemaakt voor de tabel in Oracle. Deze bevat informatie als het bijhouden van het aantal regels, het type geometrie en het bereik van alle geometrieën in de tabel. Het bijhouden van deze metadata is tijdrovend als de tabellen veel records bevatten. Door deze optie te activeren, worden de volgende snelle bewerkingen voor de metadata uitgevoerd: Het aantal regels wordt bepaald vanuit all_tables.num_rows. De bereiken van elke tabel worden altijd bepaald met de functie SDO_TUNE.EXTENTS_OF, zelfs wanneer er een filter wordt gebruikt. Het bepalen van het type geometrie wordt bepaald uit de eerste 100 regels van de tabel die geometrie bevatten.
- Alleen bestaande geometrie typen Toon alleen bestaande typen geometrie en biedt niet aan om andere toe te voegen.
Wanneer alle veldparameters en opties zijn ingesteld, kunt u de verbinding testen met de knop [Test verbinding].
Tip
QGIS Gebruikersinstellingen en beveiliging
Depending on your computing environment, storing passwords in your QGIS settings may be a security risk. Passwords are saved in clear text in the system configuration and in the project files! Your customized settings for QGIS are stored based on the operating system:
- De instellingen voor Linux worden opgeslagen in de thuismap ~.qgis2/.
 De instellingen worden opgeslagen in het register.
Laden van een Oracle Spatial-laag
Once you have one or more connections defined, you can
load layers from the Oracle database. Of course, this requires having data in
Oracle.
Voer de volgende stappen uit om een laag te laden vanuit Oracle Spatial:
- If the Add Oracle Spatial layers dialog is not already open,
click on the Add Oracle Spatial Layer toolbar
button.
Kies een aangemaakte verbinding vanuit de keuzelijst en druk op [Verbinden].
Selecteer of deselecteer het keuzevak
Ook tabellen zonder geometrie tonenOptioneel kunt u het keuzevak
Zoek opties aanvinken om een selectie te maken van objecten die geladen dienen te worden of gebruik de knop [Filter instellen] om het dialoogvenster Querybouwer te openen .Zoek naar de laag/lagen die u wilt laden uit de lijst van beschikbare tabellen met gegevens.
Selecteer deze door er op te klikken. U kunt meerdere lagen selecteren door de Shift-toets in te drukken tijdens het klikken. Zie Querybouwer voor meer informatie over het gebruiken van de Oracle Querybouwer om de laag verder te definiëren.
Klik op de knop [Toevoegen] om de laag toe te voegen aan de legenda en het kaartbeeld.
Tip
Oracle Spatial-lagen
Normaal gesproken wordt een ruimtelijke laag in ORACLE gedefinieerd door een item in de tabel USER_SDO_METADATA.