23.1.13. Vector creation
23.1.13.1. Array of offset (parallel) lines
各地物の複数のオフセットバージョンを作成することによって、レイヤ内にライン地物のコピーを作成します。それぞれの新しいバージョンは、指定された距離で徐々にオフセットされます。
Positive distance will offset lines to the left, and negative distances will offset them to the right.
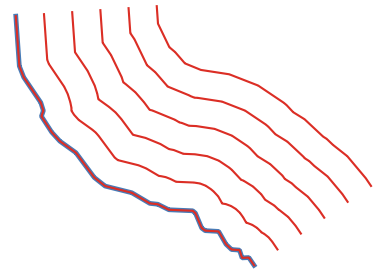
図 23.21 In blue the source layer, in red the offset one
 Allows features in-place modification
23.1.13.1.1. パラメーター
ラベル |
名前 |
タイプ |
説明 |
|---|---|---|---|
Input layer |
|
[vector: line] |
Input line vector layer to use for the offsets. |
Number of features to create |
|
[number Default: 10 |
Number of offset copies to generate for each feature |
Offset step distance |
|
[number Default: 1.0 |
Distance between two consecutive offset copies |
Segments |
|
[number] Default: 8 |
Number of line segments to use to approximate a quarter circle when creating rounded offsets |
Join style |
|
[enumeration] Default: 0 |
Specify whether round, miter or beveled joins should be used when offsetting corners in a line. One of:
|
Miter limit |
|
[number] Default: 2.0 |
マイター結合スタイルにのみ適用され、マイター結合を作成するときに使用するオフセット曲線からの最大距離を制御します。 |
Offset lines |
|
[vector: line] Default: |
Specify the output line layer with offset features. One of:
The file encoding can also be changed here. |

23.1.13.1.2. 出力
ラベル |
名前 |
タイプ |
説明 |
|---|---|---|---|
Offset lines |
|
[vector: line] |
Output line layer with offset features. The original features are also copied. |
23.1.13.1.3. Python code
Algorithm ID: qgis:arrayoffsetlines
import processing
processing.run("algorithm_id", {parameter_dictionary})
The algorithm id is displayed when you hover over the algorithm in the Processing Toolbox. The parameter dictionary provides the parameter NAMEs and values. See プロセシングアルゴリズムをコンソールから使う for details on how to run processing algorithms from the Python console.
23.1.13.2. Array of translated features
Creates copies of features in a layer by creating multiple translated versions of each. Each copy is incrementally displaced by a preset amount in the X, Y and/or Z axis.
M values present in the geometry can also be translated.

図 23.22 Input layers in blue tones, output layers with translated features in red tones
Allows
features in-place modification
23.1.13.2.1. パラメーター
ラベル |
名前 |
タイプ |
説明 |
|---|---|---|---|
Input layer |
|
[vector: any] |
Input vector layer to translate |
Number of features to create |
|
[number Default: 10 |
Number of copies to generate for each feature |
Step distance (x-axis) |
|
[number Default: 0.0 |
Displacement to apply on the X axis |
Step distance (y-axis) |
|
[number Default: 0.0 |
Displacement to apply on the Y axis |
Step distance (z-axis) |
|
[number Default: 0.0 |
Displacement to apply on the Z axis |
Step distance (m values) |
|
[number Default: 0.0 |
Displacement to apply on M |
Translated |
|
[same as input] Default: |
Output vector layer with translated (moved) copies of the features. The original features are also copied. One of:
The file encoding can also be changed here. |
23.1.13.2.2. 出力
ラベル |
名前 |
タイプ |
説明 |
|---|---|---|---|
Translated |
|
[same as input] |
Output vector layer with translated (moved) copies of the features. The original features are also copied. |
23.1.13.2.3. Python code
Algorithm ID: qgis:arraytranslatedfeatures
import processing
processing.run("algorithm_id", {parameter_dictionary})
The algorithm id is displayed when you hover over the algorithm in the Processing Toolbox. The parameter dictionary provides the parameter NAMEs and values. See プロセシングアルゴリズムをコンソールから使う for details on how to run processing algorithms from the Python console.
23.1.13.3. Create grid
Creates a vector layer with a grid covering a given extent. Grid cells can have different shapes:

図 23.23 Different grid cell shapes
The size of each element in the grid is defined using a horizontal and vertical spacing.
The CRS of the output layer must be defined.
The grid extent and the spacing values must be expressed in the coordinates and units of this CRS.
Default menu:
23.1.13.3.1. パラメーター
ラベル |
名前 |
タイプ |
説明 |
|---|---|---|---|
Grid type |
|
[enumeration] Default: 0 |
Shape of the grid. One of:
|
Grid extent |
|
[extent] |
Extent of the grid |
Horizontal spacing |
|
[number] Default: 1.0 |
Size of a grid cell on the X-axis |
Vertical spacing |
|
[number] Default: 1.0 |
Size of a grid cell on the Y-axis |
Horizontal overlay |
|
[number] Default: 0.0 |
Overlay distance between two consecutive grid cells on the X-axis |
Vertical overlay |
|
[number] Default: 0.0 |
Overlay distance between two consecutive grid cells on the Y-axis |
Grid CRS |
|
[crs] Default: Project CRS |
Coordinate reference system to apply to the grid |
Grid |
|
[vector: any] Default: |
Resulting vector grid layer. One of:
The file encoding can also be changed here. |
23.1.13.3.2. 出力
ラベル |
名前 |
タイプ |
説明 |
|---|---|---|---|
Grid |
|
[vector: any] |
Resulting vector grid layer. The output geometry type (point, line or polygon) depends on the Grid type. |
23.1.13.3.3. Python code
Algorithm ID: qgis:creategrid
import processing
processing.run("algorithm_id", {parameter_dictionary})
The algorithm id is displayed when you hover over the algorithm in the Processing Toolbox. The parameter dictionary provides the parameter NAMEs and values. See プロセシングアルゴリズムをコンソールから使う for details on how to run processing algorithms from the Python console.
23.1.13.4. Create points layer from table
Creates points layer from a table with columns that contain coordinates fields.
Besides X and Y coordinates you can also specify Z and M fields.
23.1.13.4.1. パラメーター
ラベル |
名前 |
タイプ |
説明 |
|---|---|---|---|
Input layer |
|
[vector: any] |
Input vector layer or a table. |
X field |
|
[tablefield: any] |
Field containing the X coordinate |
Y field |
|
[tablefield: any] |
Field containing the Y coordinate |
Z field Optional |
|
[tablefield: any] |
Field containing the Z coordinate |
M field Optional |
|
[tablefield: any] |
Field containing the M value |
Target CRS |
|
[crs] Default: |
Coordinate reference system to use for layer. The provided coordinates are assumed to be compliant. |
Points from table |
|
[vector: point] Default: |
Specify the resulting point layer. One of:
The file encoding can also be changed here. |
23.1.13.4.2. 出力
ラベル |
名前 |
タイプ |
説明 |
|---|---|---|---|
Points from table |
|
[vector: point] |
The resulting point layer |
23.1.13.4.3. Python code
Algorithm ID: qgis:createpointslayerfromtable
import processing
processing.run("algorithm_id", {parameter_dictionary})
The algorithm id is displayed when you hover over the algorithm in the Processing Toolbox. The parameter dictionary provides the parameter NAMEs and values. See プロセシングアルゴリズムをコンソールから使う for details on how to run processing algorithms from the Python console.
23.1.13.5. Generate points (pixel centroids) along line
Generates a point vector layer from an input raster and line layer.
The points correspond to the pixel centroids that intersect the line layer.

図 23.24 Points of the pixel centroids
23.1.13.5.1. パラメーター
ラベル |
名前 |
タイプ |
説明 |
|---|---|---|---|
Raster layer |
|
[raster] |
Input raster layer |
Vector layer |
|
[vector: line] |
Input line vector layer |
Points along line |
|
[vector: point] Default: |
Resulting point layer with pixel centroids. One of:
The file encoding can also be changed here. |
23.1.13.5.2. 出力
ラベル |
名前 |
タイプ |
説明 |
|---|---|---|---|
Points along line |
|
[vector: point] |
Resulting point layer with pixel centroids |
23.1.13.5.3. Python code
Algorithm ID: qgis:generatepointspixelcentroidsalongline
import processing
processing.run("algorithm_id", {parameter_dictionary})
The algorithm id is displayed when you hover over the algorithm in the Processing Toolbox. The parameter dictionary provides the parameter NAMEs and values. See プロセシングアルゴリズムをコンソールから使う for details on how to run processing algorithms from the Python console.
23.1.13.6. Generate points (pixel centroids) inside polygon
Generates a point vector layer from an input raster and polygon layer.
The points correspond to the pixel centroids that intersect the polygon layer.
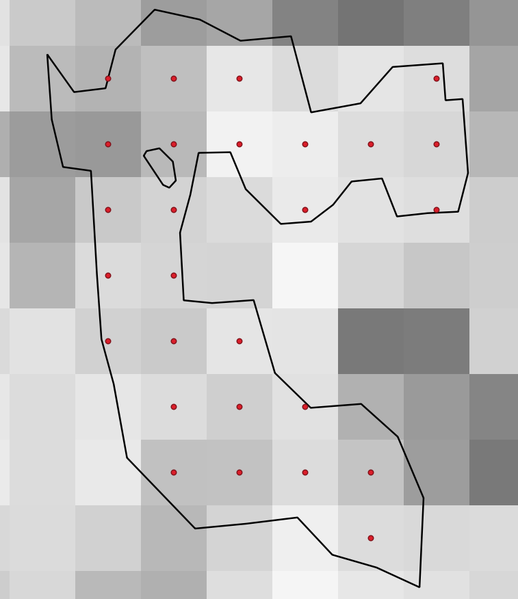
図 23.25 Points of the pixel centroids
23.1.13.6.1. パラメーター
ラベル |
名前 |
タイプ |
説明 |
|---|---|---|---|
Raster layer |
|
[raster] |
Input raster layer |
Vector layer |
|
[vector: polygon] |
Input polygon vector layer |
Points inside polygons |
|
[vector: point] Default: |
Resulting point layer of pixel centroids. One of:
The file encoding can also be changed here. |
23.1.13.6.2. 出力
ラベル |
名前 |
タイプ |
説明 |
|---|---|---|---|
Points inside polygons |
|
[vector: point] |
Resulting point layer of pixel centroids |
23.1.13.6.3. Python code
Algorithm ID: qgis:generatepointspixelcentroidsinsidepolygons
import processing
processing.run("algorithm_id", {parameter_dictionary})
The algorithm id is displayed when you hover over the algorithm in the Processing Toolbox. The parameter dictionary provides the parameter NAMEs and values. See プロセシングアルゴリズムをコンソールから使う for details on how to run processing algorithms from the Python console.
23.1.13.7. Import geotagged photos
Creates a point layer corresponding to the geotagged locations from JPEG images from a source folder.
ポイントレイヤには、入力ファイルごとにジオタグを読み取ることができる単一のPointZ地物が含まれます。ジオタグからの高度情報は、ポイントのZ値を設定するために使用されます。
経度と緯度の他に、高度、方向、タイムスタンプの情報も、写真に含まれていれば、属性としてポイントに追加されます。
23.1.13.7.1. パラメーター
ラベル |
名前 |
タイプ |
説明 |
|---|---|---|---|
Input folder |
|
[folder] |
Path to the source folder containing the geotagged photos |
Scan recursively |
|
[boolean] Default: False |
If checked, the folder and its subfolders will be scanned |
Photos |
|
[vector: point] Default: |
Specify the point vector layer for the geotagged photos. One of:
The file encoding can also be changed here. |
Invalid photos table Optional |
|
[table] Default: |
Specify the table of unreadable or non-geotagged photos. One of:
The file encoding can also be changed here. |
23.1.13.7.2. 出力
ラベル |
名前 |
タイプ |
説明 |
|---|---|---|---|
Photos |
|
[vector: point] |
Point vector layer with geotagged photos. The form of the layer is automatically filled with paths and photo previews settings. |
Invalid photos table Optional |
|
[table] |
Table of unreadable or non-geotagged photos can also be created. |
23.1.13.7.3. Python code
Algorithm ID: qgis:importphotos
import processing
processing.run("algorithm_id", {parameter_dictionary})
The algorithm id is displayed when you hover over the algorithm in the Processing Toolbox. The parameter dictionary provides the parameter NAMEs and values. See プロセシングアルゴリズムをコンソールから使う for details on how to run processing algorithms from the Python console.
23.1.13.8. Points to path
Converts a point layer to a line layer, by joining points in an order defined by a field in the input point layer (if the order field is a date/time field, the format must be specified).
Points can be grouped by a field to distinguish line features.
In addition to the line vector layer, a text file is output that describes the resulting line as a start point and a sequence of bearings / directions (relative to azimuth) and distances.
23.1.13.8.1. パラメーター
ラベル |
名前 |
タイプ |
説明 |
|---|---|---|---|
Input point layer |
|
[vector: point] |
Input point vector layer |
Order field |
|
[tablefield: any] |
Field containing the order to connect the points in the path |
Group field Optional |
|
[tablefield: any] |
Point features of the same value in the field will be grouped in the same line. If not set, a single path is drawn with all the input points. |
Date format (if order field is DateTime) Optional |
|
[string] |
The format to use for the |
Paths |
|
[vector: line] Default: |
Specify the line vector layer of the path. One of:
The file encoding can also be changed here. |
Directory for text output |
|
[folder] Default: |
Specify the directory that will contain the description files of points and paths. One of:
The file encoding can also be changed here. |
23.1.13.8.2. 出力
ラベル |
名前 |
タイプ |
説明 |
|---|---|---|---|
Paths |
|
[vector: line] |
Line vector layer of the path |
Directory for text output |
|
[folder] |
Directory containing description files of points and paths |
23.1.13.8.3. Python code
Algorithm ID: qgis:pointstopath
import processing
processing.run("algorithm_id", {parameter_dictionary})
The algorithm id is displayed when you hover over the algorithm in the Processing Toolbox. The parameter dictionary provides the parameter NAMEs and values. See プロセシングアルゴリズムをコンソールから使う for details on how to run processing algorithms from the Python console.
23.1.13.9. Random points along line
Creates a new point layer, with points placed in the lines of another layer.
For each line in the input layer, a given number of points is added to the resulting layer. A minimum distance can be specified, to avoid points being too close to each other.
23.1.13.9.1. パラメーター
ラベル |
名前 |
タイプ |
説明 |
|---|---|---|---|
Input point layer |
|
[vector: line] |
Input line vector layer |
Number of points |
|
[number] Default: 1 |
Number of points to create |
Minimum distance between points |
|
[number] Default: 0.0 |
The minimum distance between points |
Random points |
|
[vector: point] Default: |
The output random points. One of:
The file encoding can also be changed here. |
23.1.13.9.2. 出力
ラベル |
名前 |
タイプ |
説明 |
|---|---|---|---|
Random points |
|
[vector: point] |
The output random points layer. |
23.1.13.9.3. Python code
Algorithm ID: qgis:qgisrandompointsalongline
import processing
processing.run("algorithm_id", {parameter_dictionary})
The algorithm id is displayed when you hover over the algorithm in the Processing Toolbox. The parameter dictionary provides the parameter NAMEs and values. See プロセシングアルゴリズムをコンソールから使う for details on how to run processing algorithms from the Python console.
23.1.13.10. Random points in extent
指定された範囲内にあるすべてのランダムな点を指定して、新しい点レイヤーを作成します。
ポイントが互いに近すぎないように、最小距離を指定できます。
Default menu:
23.1.13.10.1. パラメーター
ラベル |
名前 |
タイプ |
説明 |
|---|---|---|---|
Input extent |
|
[extent] |
Map extent for the random points |
Number of points |
|
[number] Default: 1 |
Number of point to create |
Minimum distance between points |
|
[number] Default: 0.0 |
The minimum distance between points |
Target CRS |
|
[crs] Default: Project CRS |
CRS of the random points layer |
Random points |
|
[vector: point] Default: |
The output random points. One of:
The file encoding can also be changed here. |
23.1.13.10.2. 出力
ラベル |
名前 |
タイプ |
説明 |
|---|---|---|---|
Random points |
|
[vector: point] |
The output random points layer. |
23.1.13.10.3. Python code
Algorithm ID: qgis:randompointsinextent
import processing
processing.run("algorithm_id", {parameter_dictionary})
The algorithm id is displayed when you hover over the algorithm in the Processing Toolbox. The parameter dictionary provides the parameter NAMEs and values. See プロセシングアルゴリズムをコンソールから使う for details on how to run processing algorithms from the Python console.
23.1.13.11. Random points in layer bounds
指定したレイヤの範囲内にある、すべてのランダムなポイント数で、新しいポイントレイヤを作成します。
ポイントが互いに近すぎないように、最小距離を指定できます。
Default menu:
23.1.13.11.1. パラメーター
ラベル |
名前 |
タイプ |
説明 |
|---|---|---|---|
Input layer |
|
[vector: polygon] |
Input polygon layer defining the area |
Number of points |
|
[number] Default: 1 |
Number of points to create |
Minimum distance between points |
|
[number] Default: 0.0 |
The minimum distance between points |
Random points |
|
[vector: point] Default: |
The output random points. One of:
The file encoding can also be changed here. |
23.1.13.11.2. 出力
ラベル |
名前 |
タイプ |
説明 |
|---|---|---|---|
Random points |
|
[vector: point] |
The output random points layer. |
23.1.13.11.3. Python code
Algorithm ID: qgis:randompointsinlayerbounds
import processing
processing.run("algorithm_id", {parameter_dictionary})
The algorithm id is displayed when you hover over the algorithm in the Processing Toolbox. The parameter dictionary provides the parameter NAMEs and values. See プロセシングアルゴリズムをコンソールから使う for details on how to run processing algorithms from the Python console.
23.1.13.12. Random points inside polygons
Creates a new point layer with a given number of random points inside each polygon of the input polygon layer.
Two sampling strategies are available:
Points count: number of points for each feature
Points density: density of points for each feature
ポイントが互いに近すぎないように、最小距離を指定できます。
Default menu:
23.1.13.12.1. パラメーター
ラベル |
名前 |
タイプ |
説明 |
|---|---|---|---|
Input layer |
|
[vector: polygon] |
Input polygon vector layer |
Sampling strategy |
|
[enumeration] Default: 0 |
Sampling strategy to use. One of:
|
Point count or density |
|
[number Default: 1.0 |
The number or density of points, depending on the chosen Sampling strategy. |
Minimum distance between points |
|
[number] Default: 0.0 |
The minimum distance between points |
Random points |
|
[vector: point] Default: |
The output random points. One of:
The file encoding can also be changed here. |
23.1.13.12.2. 出力
ラベル |
名前 |
タイプ |
説明 |
|---|---|---|---|
Random points |
|
[vector: point] |
The output random points layer. |
23.1.13.12.3. Python code
Algorithm ID: qgis:randompointsinsidepolygons
import processing
processing.run("algorithm_id", {parameter_dictionary})
The algorithm id is displayed when you hover over the algorithm in the Processing Toolbox. The parameter dictionary provides the parameter NAMEs and values. See プロセシングアルゴリズムをコンソールから使う for details on how to run processing algorithms from the Python console.
23.1.13.13. Raster pixels to points
Creates a vector layer of points corresponding to each pixel in a raster layer.
ラスタレイヤをベクタレイヤに変換します。ラスタレイヤの各ピクセル中心がポイント地物に変換されます。nodata値のピクセルは出力からは省略されます。
23.1.13.13.1. パラメーター
ラベル |
名前 |
タイプ |
説明 |
|---|---|---|---|
Raster layer |
|
[raster] |
Input raster layer |
Band number |
|
[raster band] |
Raster band to extract data from |
Field name |
|
[string] Default: 'VALUE' |
Name of the field to store the raster band value |
Vector points |
|
[vector: point] Default: |
Specify the resulting point layer of pixels centroids. One of:
The file encoding can also be changed here. |
23.1.13.13.2. 出力
ラベル |
名前 |
タイプ |
説明 |
|---|---|---|---|
Vector points |
|
[vector: point] |
Resulting point layer with pixels centroids |
23.1.13.13.3. Python code
Algorithm ID: qgis:pixelstopoints
import processing
processing.run("algorithm_id", {parameter_dictionary})
The algorithm id is displayed when you hover over the algorithm in the Processing Toolbox. The parameter dictionary provides the parameter NAMEs and values. See プロセシングアルゴリズムをコンソールから使う for details on how to run processing algorithms from the Python console.
23.1.13.14. Raster pixels to polygons
ラスタレイヤの各ピクセルを表すポリゴンのベクタレイヤを作成します。
ラスタレイヤをベクタレイヤに変換します。ラスタレイヤの各ピクセル範囲がポリゴン地物に変換されます。nodata値のピクセルは出力からは省略されます。
23.1.13.14.1. パラメーター
ラベル |
名前 |
タイプ |
説明 |
|---|---|---|---|
Raster layer |
|
[raster] |
Input raster layer |
Band number |
|
[raster band] |
Raster band to extract data from |
Field name |
|
[string] Default: 'VALUE' |
Name of the field to store the raster band value |
Vector polygons |
|
[vector: polygon] Default: |
Specify the resulting polygon layer of pixel extents. One of:
The file encoding can also be changed here. |
23.1.13.14.2. 出力
ラベル |
名前 |
タイプ |
説明 |
|---|---|---|---|
Vector polygons |
|
[vector: polygon] |
Resulting polygon layer of pixel extents |
23.1.13.14.3. Python code
Algorithm ID: qgis:pixelstopolygons
import processing
processing.run("algorithm_id", {parameter_dictionary})
The algorithm id is displayed when you hover over the algorithm in the Processing Toolbox. The parameter dictionary provides the parameter NAMEs and values. See プロセシングアルゴリズムをコンソールから使う for details on how to run processing algorithms from the Python console.
23.1.13.15. Regular points
Creates a new point layer with its points placed in a regular grid within a given extent.
The grid is specified either by the spacing between the points (same spacing for all dimensions) or by the number of points to generate. In the latter case, the spacing will be determined from the extent. In order to generate a full rectangular grid, at least the number of points specified by the user is generated for the latter case.
Random offsets to the point spacing can be applied, resulting in a non-regular point pattern.
Default menu:
23.1.13.15.1. パラメーター
ラベル |
名前 |
タイプ |
説明 |
|---|---|---|---|
Input extent (xmin, xmax, ymin, ymax) |
|
[extent] |
Map extent for the random points |
Point spacing/count |
|
[number] Default: 100 |
Spacing between the points, or the number of points, depending
on whether |
Initial inset from corner (LH side) |
|
[number] Default: 0.0 |
Offsets the points relative to the upper left corner. The value is used for both the X and Y axis. |
Apply random offset to point spacing |
|
[boolean] Default: False |
If checked the points will have a random spacing |
Use point spacing |
|
[boolean] Default: True |
If unchecked the point spacing is not taken into account |
Output layer CRS |
|
[crs] Default: Project CRS |
CRS of the random points layer |
Regular points |
|
[vector: point] Default: |
Specify the output regular point layer. One of:
The file encoding can also be changed here. |
23.1.13.15.2. 出力
ラベル |
名前 |
タイプ |
説明 |
|---|---|---|---|
Regular points |
|
[vector: point] |
The output regular point layer. |
23.1.13.15.3. Python code
Algorithm ID: qgis:regularpoints
import processing
processing.run("algorithm_id", {parameter_dictionary})
The algorithm id is displayed when you hover over the algorithm in the Processing Toolbox. The parameter dictionary provides the parameter NAMEs and values. See プロセシングアルゴリズムをコンソールから使う for details on how to run processing algorithms from the Python console.