16. メッシュデータの操作
16.1. メッシュとは?
A mesh is an unstructured grid usually with temporal and other components. The spatial component contains a collection of vertices, edges and faces in 2D or 3D space:
vertices - XY(Z) points (in the layer's coordinate reference system)
edges - connect pairs of vertices
面 - 面は閉じた形状を形成する辺の集合です。通常は三角形または四辺形(quad)ですが、頂点数が多い多角形はめったにありません。

図 16.1 さまざまなメッシュタイプ
QGISでは現在、三角形または正四角形を使用してメッシュデータをレンダリングできます。
メッシュは空間構造に関する情報を提供します。さらに、メッシュはすべての頂点に値を割り当てるデータセット(グループ)を持つことができます。たとえば、次の図に示すように頂点が番号付けされた三角メッシュを作成します:

図 16.2 Triangular grid with numbered vertices
各頂点は異なるデータセット(通常は複数の数量)を格納でき、それらのデータセットは時間的な次元を持つこともできます。したがって、1つのファイルに複数のデータセットを含めることができます。
次の表は、メッシュデータセットに格納できる情報についての概念を示しています。テーブルの列はメッシュの頂点のインデックスを表し、各行は1つのデータセットを表します。データセットはさまざまなデータ型を持つことができます。この場合、それには時間内の特定の瞬間(t1、t2、t3)での地上10mでの風速が格納されます。
同様に、メッシュデータセットは各頂点のベクトル値も格納できます。たとえば、与えられたタイムスタンプでの風向ベクトルは、
10 metre wind |
1 |
2 |
3 |
... |
|---|---|---|---|---|
10 metre speed at time=t1 |
17251 |
24918 |
32858 |
... |
10 metre speed at time=t2 |
19168 |
23001 |
36418 |
... |
10 metre speed at time=t3 |
21085 |
30668 |
17251 |
... |
... |
... |
... |
... |
... |
10m wind direction time=t1 |
[20,2] |
[20,3] |
[20,4.5] |
... |
10m wind direction time=t2 |
[21,3] |
[21,4] |
[21,5.5] |
... |
10m wind direction time=t3 |
[22,4] |
[22,5] |
[22,6.5] |
... |
... |
... |
... |
... |
... |
色を値に割り当てて ( Singleband pseudocolor ラスタレンダリングと同様に) 、メッシュトポロジに従って頂点間でデータを補間することでデータを視覚化できます。いくつかの量が単純なスカラー値ではなく2Dベクトルであることはよくあることです(例えば風向)。そのような量については、方向を示す矢印を表示することが望ましい。
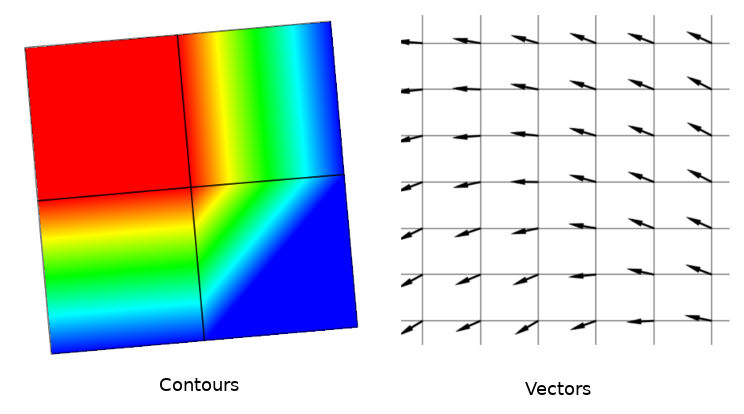
図 16.3 Possible visualisation of mesh data
16.2. サポートされる形式
QGIS accesses mesh data using the MDAL drivers. Hence, the natively supported formats are:
NetCDF: Generic format for scientific dataGRIB: Format commonly used in meteorologyXMDF: As an example, hydraulic outputs from TUFLOW modelling packageDAT: Outputs of various hydrodynamic modelling packages (e.g. BASEMENT, HYDRO_AS-2D, TUFLOW)3Di: 3Di modelling package format based on Climate and Forecast Conventions (http://cfconventions.org/)Some examples of mesh datasets can be found at https://apps.ecmwf.int/datasets/data/interim-full-daily/levtype=sfc/
To load a mesh dataset into QGIS, use the  Mesh tab
in the Data Source Manager dialog. Read メッシュレイヤを読み込む for
more details.
Mesh tab
in the Data Source Manager dialog. Read メッシュレイヤを読み込む for
more details.
16.3. メッシュデータセットのプロパティ
16.3.1. Information Properties

図 16.4 メッシュレイヤのプロパティ
情報 タブは読み取り専用で、現在のレイヤーの要約された情報とメタデータを素早くつかむための興味深い場所を表しています。提供される情報は、(レイヤのプロバイダに基づく)URI、頂点数、面数、およびデータセットグループ数です。
16.3.2. Source Properties
:guilabel:ソース タブは選択されたメッシュに関する基本的な情報を表示します、たとえば:
the Layer name to display in the Layers panel
setting the Coordinate Reference System: Displays the layer’s Coordinate Reference System (CRS). You can change the layer’s CRS by selecting a recently used one in the drop-down list or clicking on
 Select CRS button (see 座標参照系の選択).
Use this process only if the CRS applied to the layer is wrong or
if none was applied.
Select CRS button (see 座標参照系の選択).
Use this process only if the CRS applied to the layer is wrong or
if none was applied.
現在のメッシュレイヤにさらにグループを追加するには、 メッシュへの追加データセットの割り当て ボタンを使用してください。
16.3.3. Symbology Properties
Click the  Symbology button to activate the dialog
as shown in the following image:
Symbology button to activate the dialog
as shown in the following image:

図 16.5 Mesh Layer Symbology
Symbology properties are divided in several tabs:
16.3.3.1. 一般
The tab  presents the following items:
groups available in the mesh dataset
dataset in the selected group(s), for example, if the layer has a temporal dimension
metadata if available
blending mode available for the selected dataset.
The slider  , the combo box
  and the |<,
<, >, >| buttons
allow to explore another dimension of the data, if available.
As the slider moves, the metadata is presented accordingly.
See the figure Mesh groups below as an example.
The map canvas will display the selected dataset group as well.
and the |<,
<, >, >| buttons
allow to explore another dimension of the data, if available.
As the slider moves, the metadata is presented accordingly.
See the figure Mesh groups below as an example.
The map canvas will display the selected dataset group as well.

図 16.6 Dataset in Selected Group(s)
You can apply symbology to each group using the tabs.
16.3.3.2. 等高線の表記法
Under Groups, click on  to show contours with
default visualization parameters.
to show contours with
default visualization parameters.
In the tab  you can see and change the current visualization
options of contours for the selected group, as shown in
図 16.7 below:
you can see and change the current visualization
options of contours for the selected group, as shown in
図 16.7 below:

図 16.7 メッシュレイヤで等高線のスタイルを設定する
Use the slide bar or combo box to set the opacity of the current group.
Use Load to adjust the min and max values of the current group.
補間 リストには、等高線を描画するための3つのオプションがあります: 線形 、 :guilabel: 離散 、 正確 。
The Color ramp widget opens the color ramp drop-down shortcut.
ラベル単位接尾辞 は凡例の値の後に追加されるラベルです。
By selecting Continuous in the classification Mode, QGIS creates classes automatically considering the Min and Max values. With ‘Equal interval’, you only need to select the number of classes using the combo box Classes and press the button Classify.
ボタン  手動で値を追加 は個々のカラーテーブルに値を追加します。ボタン
  選択した行を削除 は個々のカラーテーブルから値を削除します。値の列をダブルクリックすると、特定の値を挿入できます。色の列をダブルクリックすると、ダイアログ 色の変更 が開き、その値に適用する色を選択できます。
16.3.3.3. ベクタの表記法
In the tab , click on to display vectors if available.
The map canvas will display the vectors in the selected group with default parameters.
Click on the tab  to change the visualization parameters for vectors
as shown in the image below:
to change the visualization parameters for vectors
as shown in the image below:

図 16.8 メッシュレイヤでベクタのスタイルを設定する
線幅はコンボボックスまたは値を入力して設定できます。カラーウィジェットはダイアログ 色の変更 を開きます。ここでベクトルに適用する色を選択できます。
Enter values for Min and Max to filter vectors according to their magnitude.
チェックボックス ユーザーグリッドにベクトルを表示する をオンにして Xの間隔 と Yの間隔 を指定すると、QGISは与えられた間隔を考慮してベクトルを描画します。
With the Head Options Head Options, QGIS allows the shape of the arrow head to be set by specifying width and length (in percentage).
ベクタの 矢印の長さ は3つの異なる方法でQGISで描画できます。
最小値と最大値で定義:ベクトルの最小長と最大長を指定します。QGISはそれに応じて視覚化を調整します。
大きさへのスケール:使用する(倍率)係数を指定します
固定:すべてのベクトルが同じ長さで表示されます
16.3.3.4. レンダリング
In the tab  , QGIS offers two possibilities to display the grid,
as shown in 図 16.9:
, QGIS offers two possibilities to display the grid,
as shown in 図 16.9:
Native Mesh Renderingthat shows quadrantsTriangular Mesh Renderingthat display triangles

図 16.9 Mesh Rendering
このダイアログでは線幅と色を変更でき、両方のグリッドレンダリングをオフにできます。