.
QGIS GUI
When QGIS starts, you are presented with the GUI as shown in the figure (the numbers 1 through 5 in yellow circles are discussed below).
Figure QGIS GUI 1:
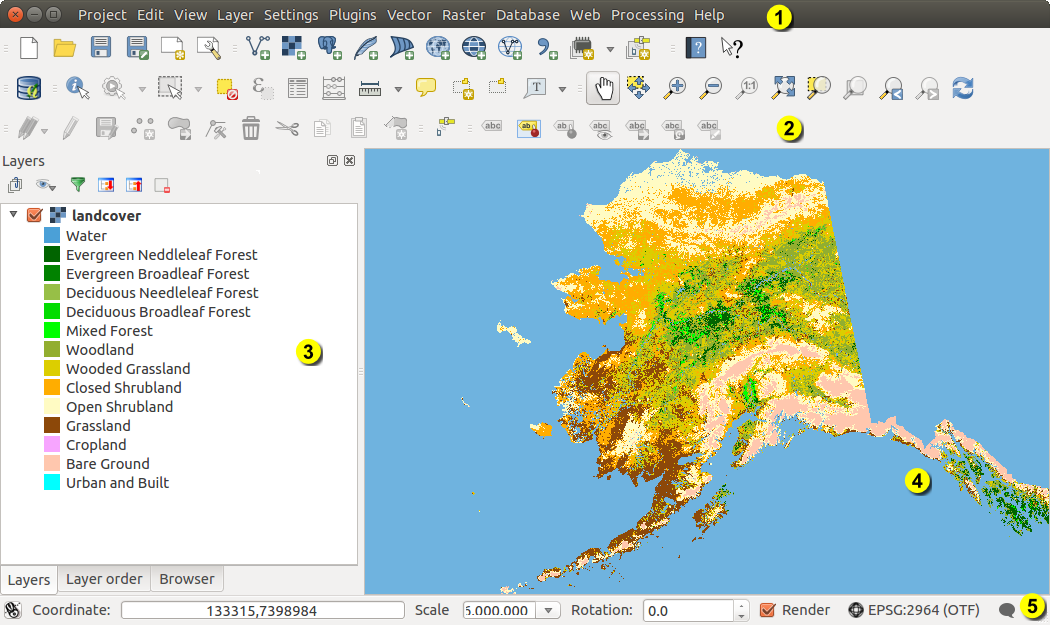
QGIS GUI with Alaska sample data 
Note
Le style des fenêtres peut apparaître différemment en fonction de votre système d’exploitation et de votre gestionnaire de fenêtres.
The QGIS GUI is divided into five areas:
Barre de Menu
- Tool Bar
- Map Legend
Affichage de la carte
Barre d’état
These five components of the QGIS interface are described in more detail in the following sections. Two more sections present keyboard shortcuts and context help.
Barre de Menu
The menu bar provides access to various QGIS features using a standard hierarchical menu. The top-level menus and a summary of some of the menu options are listed below, together with the associated icons as they appear on the toolbar, and keyboard shortcuts. The shortcuts presented in this section are the defaults; however, keyboard shortcuts can also be configured manually using the Configure shortcuts dialog, opened from Settings ‣ Configure Shortcuts....
Bien que les options de menu aient des outils qui leur correspondent et vice-versa, les menus ne sont pas organisés comme les barres d’outils. La barre contenant l’outil est affichée sous chaque option de menu en tant que case à cocher. Certaines entrées n’apparaissent que lorsque les extensions correspondantes sont activées. Pour plus d’informations sur les outils et les barres d’outils, veuillez lire la section Barre d’outils.
Projet
Barre de Menu |
Raccourci |
Référence |
Barre d’outils |
|---|---|---|---|
 New New |
Ctrl+N | voir Les projets |
Projet |
 Open Open |
Ctrl+O | voir Les projets |
Projet |
Nouveau depuis un modèle ‣ |
voir Les projets |
Projet |
|
| Open Recent ‣ | voir Les projets |
||
 Save Save |
Ctrl+S | voir Les projets |
Projet |
 Save As... Save As... |
Ctrl+Shift+S | voir Les projets |
Projet |
 Save as Image... Save as Image... |
voir Sortie graphique |
||
| DXF Export ... | voir Sortie graphique |
||
 New Print Composer New Print Composer |
Ctrl+P | Projet |
|
 Composer manager ... Composer manager ... |
Projet |
||
Composeurs d’impression ‣ |
|||
 Exit QGIS Exit QGIS |
Ctrl+Q |
Éditer
Barre de Menu |
Raccourci |
Référence |
Barre d’outils |
|---|---|---|---|
 Undo Undo |
Ctrl+Z | voir Numérisation avancée |
Numérisation avancée |
 Redo Redo |
Ctrl+Shift+Z | voir Numérisation avancée |
Numérisation avancée |
 Cut Features Cut Features |
Ctrl+X | Numérisation |
|
 Copy Features Copy Features |
Ctrl+C | Numérisation |
|
 Paste Features Paste Features |
Ctrl+V | Numérisation |
|
Coller les entités comme ‣ |
|||
 Add Feature Add Feature |
Ctrl+. | Numérisation |
|
 Move Feature(s) Move Feature(s) |
Numérisation |
||
 Delete Selected Delete Selected |
Numérisation |
||
 Rotate Feature(s) Rotate Feature(s) |
voir Numérisation avancée |
Numérisation avancée |
|
 Simplify Feature Simplify Feature |
voir Numérisation avancée |
Numérisation avancée |
|
 Add Ring Add Ring |
voir Numérisation avancée |
Numérisation avancée |
|
 Add Part Add Part |
voir Numérisation avancée |
Numérisation avancée |
|
 Fill Ring Fill Ring |
voir Numérisation avancée |
Numérisation avancée |
|
 Delete Ring Delete Ring |
voir Numérisation avancée |
Numérisation avancée |
|
 Delete Part Delete Part |
voir Numérisation avancée |
Numérisation avancée |
|
 Reshape Features Reshape Features |
voir Numérisation avancée |
Numérisation avancée |
|
 Offset Curve Offset Curve |
voir Numérisation avancée |
Numérisation avancée |
|
 Split Features Split Features |
voir Numérisation avancée |
Numérisation avancée |
|
 Split Parts Split Parts |
voir Numérisation avancée |
Numérisation avancée |
|
 Merge Selected Features Merge Selected Features |
voir Numérisation avancée |
Numérisation avancée |
|
| Merge Attr. of Selected Features |
voir Numérisation avancée |
Numérisation avancée |
|
 Node Tool Node Tool |
Numérisation |
||
| Rotate Point Symbols |
voir Numérisation avancée |
Numérisation avancée |
After activating  Toggle editing mode for a layer,
you will find the Add Feature icon in the Edit menu
depending on the layer type (point, line or polygon).
Toggle editing mode for a layer,
you will find the Add Feature icon in the Edit menu
depending on the layer type (point, line or polygon).
Éditer (selon le type de couche)
Barre de Menu |
Raccourci |
Référence |
Barre d’outils |
|---|---|---|---|
| Add Feature |
Numérisation |
||
 Add Feature Add Feature |
Numérisation |
||
 Add Feature Add Feature |
Numérisation |
Affichage de la carte
Barre de Menu |
Raccourci |
Référence |
Barre d’outils |
|---|---|---|---|
 Pan Map Pan Map |
Navigateur de carte |
||
 Pan Map to Selection Pan Map to Selection |
Navigateur de carte |
||
 Zoom In Zoom In |
Ctrl++ | Navigateur de carte |
|
 Zoom Out Zoom Out |
Ctrl+- | Navigateur de carte |
|
Sélection ‣ |
Attributs |
||
 Identify Features Identify Features |
Ctrl+Shift+I | Attributs |
|
Mesure ‣ |
voir Mesurer |
Attributs |
|
 Zoom Full Zoom Full |
Ctrl+Shift+F | Navigateur de carte |
|
 Zoom To Layer Zoom To Layer |
Navigateur de carte |
||
 Zoom To Selection Zoom To Selection |
Ctrl+J | Navigateur de carte |
|
 Zoom Last Zoom Last |
Navigateur de carte |
||
 Zoom Next Zoom Next |
Navigateur de carte |
||
 Zoom Actual Size Zoom Actual Size |
Navigateur de carte |
||
Décorations ‣ |
voir Décorations |
||
Mode d’affichage ‣ |
|||
 Map Tips Map Tips |
Attributs |
||
 New Bookmark New Bookmark |
Ctrl+B | voir Signets spatiaux |
Attributs |
 Show Bookmarks Show Bookmarks |
Ctrl+Shift+B | voir Signets spatiaux |
Attributs |
 Refresh Refresh |
F5 | Navigateur de carte |
Couche
Barre de Menu |
Raccourci |
Référence |
Barre d’outils |
|---|---|---|---|
Créer une couche ‣ |
Contrôle des couches |
||
Ajouter une couche ‣ |
Contrôle des couches |
||
| Embed Layers and Groups ... | voir Inclusion de projets |
||
| Add from Layer Definition File ... | |||
| Copy style |
see Onglet Style | ||
| Paste style |
see Onglet Style | ||
 Open Attribute Table Open Attribute Table |
Attributs |
||
| Toggle Editing |
Numérisation |
||
| Save Layer Edits |
Numérisation |
||
 Current Edits ‣ Current Edits ‣ |
Numérisation |
||
| Save as... | |||
| Save as layer definition file... | |||
 Remove Layer/Group Remove Layer/Group |
Ctrl+D | ||
 Duplicate Layers (s) Duplicate Layers (s) |
|||
Définir l’échelle de visibilité |
|||
| Set CRS of Layer(s) | Ctrl+Shift+C | ||
| Set project CRS from Layer | |||
| Properties ... | |||
| Query... | |||
 Labeling Labeling |
|||
 Add to Overview Add to Overview |
Ctrl+Shift+O | Contrôle des couches |
|
 Add All To Overview Add All To Overview |
|||
 Remove All From Overview Remove All From Overview |
|||
 Show All Layers Show All Layers |
Ctrl+Shift+U | Contrôle des couches |
|
 Hide All Layers Hide All Layers |
Ctrl+Shift+H | Contrôle des couches |
|
| Show selected Layers |
|||
| Hide selected Layers |
Préférences
Barre de Menu |
Raccourci |
Référence |
Barre d’outils |
|---|---|---|---|
Panneaux ‣ |
voir Panels and Toolbars |
||
Barres d’outils ‣ |
voir Panels and Toolbars |
||
| Toggle Full Screen Mode | F 11 | ||
 Project Properties ... Project Properties ... |
Ctrl+Shift+P | voir Les projets |
|
 Custom CRS ... Custom CRS ... |
|||
Gestionnaire de symboles... |
voir Presentation |
||
 Configure shortcuts ... Configure shortcuts ... |
|||
| Customization ... |
voir Personnalisation |
||
| Options ... |
voir Options |
||
| Snapping Options ... |
Extensions
Barre de Menu |
Raccourci |
Référence |
Barre d’outils |
|---|---|---|---|
 Manage and Install Plugins ... Manage and Install Plugins ... |
|||
| Python Console | Ctrl+Alt+P |
When starting QGIS for the first time not all core plugins are loaded.
Vecteur
Barre de Menu |
Raccourci |
Référence |
Barre d’outils |
|---|---|---|---|
| Open Street Map ‣ | |||
|
voir Extension fTools |
||
|
voir Extension fTools |
||
|
voir Extension fTools |
||
|
voir Extension fTools |
||
|
voir Extension fTools |


When starting QGIS for the first time not all core plugins are loaded.
Raster
Barre de Menu |
Raccourci |
Référence |
Barre d’outils |
|---|---|---|---|
| Raster calculator ... | see Calculatrice Raster |
When starting QGIS for the first time not all core plugins are loaded.
Base de données
Barre de Menu |
Raccourci |
Référence |
Barre d’outils |
|---|---|---|---|
Base de données ‣ |
voir Extension DB Manager |
Base de données |
When starting QGIS for the first time not all core plugins are loaded.
Web
Barre de Menu |
Raccourci |
Référence |
Barre d’outils |
|---|---|---|---|
| Metasearch | Internet |
When starting QGIS for the first time not all core plugins are loaded.
Traitement
Barre de Menu |
Raccourci |
Référence |
Barre d’outils |
|---|---|---|---|
 Toolbox Toolbox |
voir La boîte à outils |
||
 Graphical Modeler ... Graphical Modeler ... |
|||
 History and log ... History and log ... |
|||
 Options ... Options ... |
|||
 Results viewer ... Results viewer ... |
|||
 Commander Commander |
Ctrl+Alt+M |
When starting QGIS for the first time not all core plugins are loaded.
Aide
Barre de Menu |
Raccourci |
Référence |
Barre d’outils |
|---|---|---|---|
 Help Contents Help Contents |
F1 | Aide |
|
 What’s This? What’s This? |
Shift+F1 | Aide |
|
| API Documentation | |||
| Need commercial support? | |||
 QGIS Home Page QGIS Home Page |
Ctrl+H | ||
 Check QGIS Version Check QGIS Version |
|||
 About About |
|||
 QGIS Sponsors QGIS Sponsors |
Please note that for Linux , the menu bar items listed above are the
default ones in the KDE window manager. In GNOME, the Settings menu
has different content and its items have to be found here:
| Custom CRS |
Edit |
| Style Manager | Edit |
| Configure Shortcuts |
Edit |
| Customization |
Edit |
| Options |
Edit |
| Snapping Options ... | Edit |
Barre d’outils
La barre d’outils fournit un accès à la majorité des fonctions des menus en plus d’outils additionnels destinés à interagir avec la carte. Chaque outil dispose d’une bulle d’aide qui s’affiche lorsque vous placez votre curseur au-dessus. Celle-ci affiche une courte description du rôle de l’outil.
Every menu bar can be moved around according to your needs. Additionally, every menu bar can be switched off using your right mouse button context menu, holding the mouse over the toolbars (read also Panels and Toolbars).
Astuce
Restaurer des barres d’outils
If you have accidentally hidden all your toolbars, you can get them back by choosing menu option Settings ‣ Toolbars ‣. If a toolbar disappears under Windows, which seems to be a problem in QGIS from time to time, you have to remove key \HKEY_CURRENT_USER\Software\QGIS\qgis\UI\state in the registry. When you restart QGIS, the key is written again with the default state, and all toolbars are visible again.
Map Legend
The map legend area lists all the layers in the project. The checkbox in each legend entry can be used to show or hide the layer. The Legend toolbar in the map legend are list allow you to Add group, Manage Layer Visibility of all layers or manage preset layers combination, Filter Legend by Map Content, Expand All or Collapse All and Remove Layer or Group.
Figure Layer tools Bar:
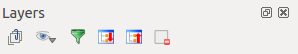
Layer Tool Bar in Map Legend
The button  allows you to add Presets views in the legend. It means that you can choose to display some layer with specific categorization and add this view to the Presets list. To add a preset view just click on , choose Add Preset... from the drop down menu and give a name to the preset. After that you will see a list with all the presets that you can recall pressing on the button.
Toutes les vues prédéfinies ajoutées sont également présentes dans le composeur de carte pour vous permettre de créer une mise en page de carte basée sur des vues spécifiques (consultez Propriétés principales).
Une couche peut être sélectionnée et glissée vers le haut ou le bas dans la légende pour modifier l’ordre d’empilement des couches. Une couche se situant au sommet de la liste de cette légende sera affichée au-dessus de celles qui se situent plus bas dans la liste.
Note
This behaviour can be overridden by the ‘Layer order’ panel.
Layers in the legend window can be organised into groups. There are two ways to do this:
- Press the
 icon to add a new group. Type in a name for
the group and press Enter. Now click on an existing layer and
drag it onto the group.
icon to add a new group. Type in a name for
the group and press Enter. Now click on an existing layer and
drag it onto the group. Sélectionnez des couches, faites un clic droit dans la légende et choisissez Grouper la sélection. Les couches sélectionnées seront automatiquement placées dans un nouveau groupe.
Pour retirer une couche d’un groupe, il suffit de pointer votre curseur sur elle, de la glisser-déposer en dehors ou de faire un clic droit et de choisir Mettre l’objet au-dessus. Un groupe peut contenir d’autres groupes.
La case à cocher d’un groupe permet d’afficher ou de cacher toutes les couches du groupe en un seul clic.
The content of the right mouse button context menu depends on whether the
selected legend item is a raster or a vector layer. For GRASS vector layers,
Toggle editing is not available. See section
Numérisation et édition de couche vectorielle GRASS for information on editing GRASS vector layers.
Right mouse button menu for raster layers
- Zoom to Layer
- Show in overview
- Zoom to Best Scale (100%)
- Remove
- Duplicate
Définir l’échelle de visibilité
- Set Layer CRS
Définir le SCR du projet depuis cette couche
- Styles ‣
- Save as ...
- Save As Layer Definition File ...
Propriétés...
Renommer
Additionally, according to layer position and selection
Monter au premier-plan
Grouper la sélection
Right mouse button menu for vector layers
- Zoom to Layer
- Show in overview
- Remove
- Duplicate
Définir l’échelle de visibilité
- Set Layer CRS
Définir le SCR du projet depuis cette couche
- Styles ‣
- Open Attribute Table
- Toggle Editing (not available for GRASS layers)
- Save As ...
- Save As Layer Definition Style
Filtrer
- Show Feature Count
Propriétés...
Renommer
Additionally, according to layer position and selection
Monter au premier-plan
Grouper la sélection
Right mouse button menu for layer groups
- Zoom to Group
- Remove
- Set Group CRS
Renommer
- Add Group
Il est possible de sélectionner plus d’une couche ou groupe à la fois en tenant appuyée la touche Ctrl pendant que vous sélectionnez les couches avec le bouton gauche de la souris. Vous pouvez alors déplacer en une fois toutes les couches sélectionnées dans un nouveau groupe.
You may also delete more than one layer or group at once by selecting several layers with the Ctrl key and pressing Ctrl+D afterwards. This way, all selected layers or groups will be removed from the layers list.
Travailler avec un ordre des couches dans la légende indépendant du rendu cartographique
There is a panel that allows you to define an independent drawing order for the map legend.
You can activate it in the menu Settings ‣ Panels ‣ Layer
order. This feature allows you to, for instance, order your layers in order of importance,
but still display them in the correct order (see figure_layer_order).
Checking the  Control rendering order box underneath the
list of layers will cause a revert to default behavior.
Control rendering order box underneath the
list of layers will cause a revert to default behavior.
Figure Layer Order:
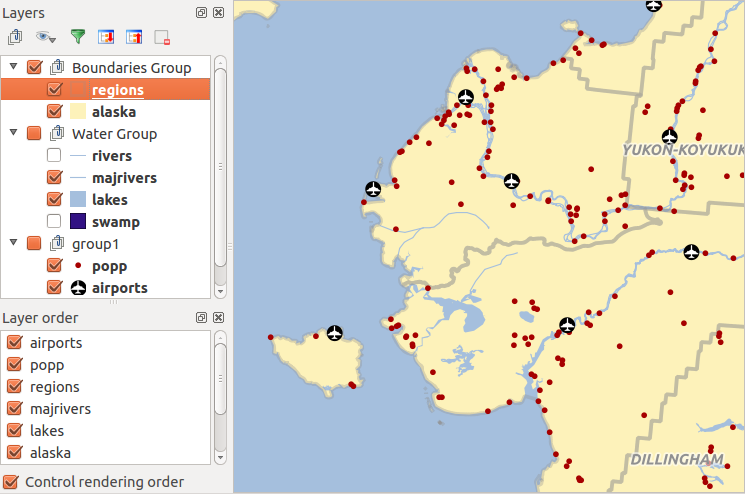
Define a legend independent layer order
Affichage de la carte
This is the “business end” of QGIS — maps are displayed in this area! The map displayed in this window will depend on the vector and raster layers you have chosen to load (see sections that follow for more information on how to load layers). The map view can be panned, shifting the focus of the map display to another region, and it can be zoomed in and out. Various other operations can be performed on the map as described in the toolbar description above. The map view and the legend are tightly bound to each other — the maps in view reflect changes you make in the legend area.
Astuce
Zoomer sur la carte avec la molette de la souris
Vous pouvez utiliser la molette de la souris pour changer le niveau de zoom de la carte. Placez votre curseur dans la zone d’affichage de la carte et faites rouler la molette vers l’avant pour augmenter l’échelle, vers vous pour la réduire. La vue sera recentrée sur la position du curseur de la souris. Vous pouvez modifier le comportement de la molette de la souris en utilisant l’onglet Outils cartographiques dans le menu Préférences ‣ Options.
Astuce
Se déplacer sur la carte avec les flèches et la barre espace
Vous pouvez utiliser les flèches du clavier pour vous déplacer sur la carte. Placez le curseur sur la carte et appuyez sur la flèche droite pour décaler la vue vers l’Est, la flèche gauche pour la décaler vers l’Ouest, la flèche supérieure vers le Nord et la flèche inférieure vers le Sud. Vous pouvez aussi déplacer la carte en gardant la touche espace appuyée et en bougeant la souris ou encore simplement en gardant la molette de la souris appuyée.
Barre d’état
The status bar shows you your current position in map coordinates (e.g., meters or decimal degrees) as the mouse pointer is moved across the map view. To the left of the coordinate display in the status bar is a small button that will toggle between showing coordinate position or the view extents of the map view as you pan and zoom in and out.
Next to the coordinate display you will find the scale display. It shows the scale of the map view. If you zoom in or out, QGIS shows you the current scale. There is a scale selector, which allows you to choose between predefined scales from 1:500 to 1:1000000.
À droite de l’affichage de l’échelle, vous pouvez définir un angle de rotation horaire en degrés à appliquer à la carte.
A progress bar in the status bar shows the progress of rendering as each layer is drawn to the map view. In some cases, such as the gathering of statistics in raster layers, the progress bar will be used to show the status of lengthy operations.
If a new plugin or a plugin update is available, you will see a message at the
far left of the status bar. On the right side of the status bar, there is a small
checkbox which can be used to temporarily prevent layers being rendered to the
map view (see section Rendu below). The icon  immediately stops the current map rendering process.
To the right of the render functions, you find the EPSG code of the current project CRS and a projector icon. Clicking on this opens the projection properties for the current project.
Astuce
Calculer l’échelle correcte de la carte
When you start QGIS, the default units are degrees, and this means that QGIS will interpret any
coordinate in your layer as specified in degrees. To get correct scale values, you can
either change this setting to meters manually in the General tab
under Settings ‣ Project Properties, or you can select a
project CRS clicking on the  Current CRS: icon in the
lower right-hand corner of the status bar. In the last case, the units are set to what the
project projection specifies (e.g., ‘+units=m’).
Current CRS: icon in the
lower right-hand corner of the status bar. In the last case, the units are set to what the
project projection specifies (e.g., ‘+units=m’).