.
Outils généraux
Raccourcis clavier
QGIS provides default keyboard shortcuts for many features. You can find them in section Barre de Menu. Additionally, the menu option Settings ‣ Configure Shortcuts.. allows you to change the default keyboard shortcuts and to add new keyboard shortcuts to QGIS features.
Figure Shortcuts 1:
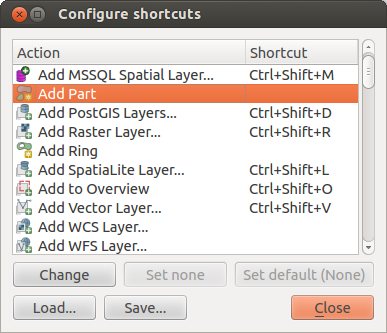
Define shortcut options  (Gnome)
Configuration is very simple. Just select a feature from the list and click on [Change], [Set none] or [Set default]. Once you have finished your configuration, you can save it as an XML file and load it to another QGIS installation.
Aide contextuelle
Lorsque vous avez besoin d’aide sur un sujet spécifique, vous pouvez accéder à l’aide contextuelle via le bouton [Aide] disponible dans la plupart des fenêtres — notez que les extensions additionnelles peuvent pointer vers des pages web dédiées.
Rendu
By default, QGIS renders all visible layers whenever the map canvas is refreshed. The events that trigger a refresh of the map canvas include:
l’ajout d’une couche
le déplacement ou le zoom
- Resizing the QGIS window
la modification de la visibilité d’une ou plusieurs couches
QGIS allows you to control the rendering process in a number of ways.
Rendu dépendant de l’échelle
Le rendu dépendant de l’échelle permet de spécifier des échelles minimale et maximale auxquelles la couche doit être visible. Pour définir une échelle de rendu, ouvrez la fenêtre de Propriétés en double-cliquant sur une couche dans la légende et dans l’onglet Général, cochez la case  Visibilité dépendante de l’échelle puis saisissez les valeurs voulues.
You can determine the scale values by first zooming to the level you want to use and noting the scale value in the QGIS status bar.
Contrôler le rendu
Map rendering can be controlled in the various ways, as described below.
Suspendre le rendu
To suspend rendering, click the Render checkbox in the
lower right corner of the status bar. When the Render
checkbox is not checked, QGIS does not redraw the canvas in response to any of
the events described in section Rendu. Examples of when you
might want to suspend rendering include:
Ajouter plusieurs couches et réaliser leur symbologie avant de les afficher
Ajouter une ou plusieurs couches et définir leur dépendance d’échelle avant de les afficher
Ajouter une ou plusieurs couches et zoomer à une vue spécifique avant de les afficher
N’importe quelle combinaison des éléments précédents
Cocher la case Rendu activera de nouveau le rendu et provoquera un rafraîchissement immédiat de la carte.
Définir les options d’ajout de couche
Il est possible de définir une option qui chargera toutes les nouvelles couches sans les dessiner, elles seront ajoutées à la carte, mais la case de visibilité sera décochée par défaut. Pour définir cette option, sélectionnez l’option Préférences ‣ Options et cliquez sur l’onglet Rendu. Décochez la case Par défaut les couches supplémentaires sont affichées. Les nouvelles couches ajoutées à la carte seront invisibles par défaut.
Arrêter le rendu
Pour arrêter le rendu de la carte, appuyez sur la touche ESC. Ceci stoppera le rafraîchissement de la vue de la carte et laissera la carte partiellement dessinée. Il est possible qu’il y ait un délai entre le moment où la touche est pressée et le moment où le rendu de la carte est effectivement arrêté.
Note
Il n’est maintenant plus possible d’arrêter le rendu — cela a été désactivé dans Qt4 à cause de problèmes et de crashes dans l’interface utilisateur (IHM).
Updating the Map Display During Rendering
You can set an option to update the map display as features are drawn. By default, QGIS does not display any features for a layer until the entire layer has been rendered. To update the display as features are read from the datastore, choose menu option Settings ‣ Options and click on the Rendering tab. Set the feature count to an appropriate value to update the display during rendering. Setting a value of 0 disables update during drawing (this is the default). Setting a value too low will result in poor performance, as the map canvas is continually updated during the reading of the features. A suggested value to start with is 500.
Influencer la qualité du rendu
To influence the rendering quality of the map, you have two options. Choose menu option Settings ‣ Options, click on the Rendering tab and select or deselect following checkboxes:
- Make lines appear less jagged at the expense of some
drawing performance
- Fix problems with incorrectly filled polygons
Accéler le rendu
There are two settings that allow you to improve rendering speed. Open the QGIS options dialog using Settings ‣ Options, go to the Rendering tab and select or deselect the following checkboxes:
- Enable back buffer. This provides better graphics
performance at the cost of losing the possibility to cancel rendering and
incrementally draw features. If it is unchecked, you can set the
Number of features to draw before updating the display, otherwise
this option is inactive.
- Utiliser le cache du rendu si possible pour accélérer l’affichage
Mesurer
Measuring works within projected coordinate systems (e.g., UTM) and unprojected data. If the loaded map is defined with a geographic coordinate system (latitude/longitude), the results from line or area measurements will be incorrect. To fix this, you need to set an appropriate map coordinate system (see section Utiliser les projections). All measuring modules also use the snapping settings from the digitizing module. This is useful, if you want to measure along lines or areas in vector layers.
To select a measuring tool, click on  and select the tool you want
to use.
and select the tool you want
to use.
Measure length, areas and angles
Measure Line: QGIS is able to measure real distances
between given points according to a defined ellipsoid. To configure this,
choose menu option Settings ‣ Options, click on the
Map tools tab and select the appropriate ellipsoid. There, you can
also define a rubberband color and your preferred measurement units (meters or
feet) and angle units (degrees, radians and gon). The tool then allows you to
click points on the map. Each segment length, as well as the total, shows up in
the measure window. To stop measuring, click your right mouse button.
Note that you can interactively change the measurement units in the measurement
dialog. It overrides the Preferred measurement units in the options.
There is an info section in the dialog that shows which CRS settings are being used
during measurement calculations.
Figure Measure 1:
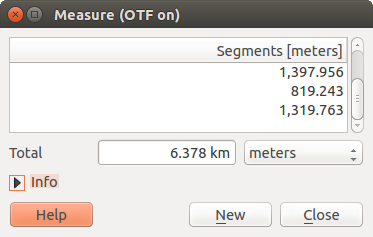
Measure Distance (Gnome)
 Measure Area: Areas can also be measured. In the
measure window, the accumulated area size appears. In addition, the measuring
tool will snap to the currently selected layer, provided that layer has its
snapping tolerance set (see section Définir le rayon de tolérance d’accrochage et de recherche). So, if you want
to measure exactly along a line feature, or around a polygon feature, first set
its snapping tolerance, then select the layer. Now, when using the measuring
tools, each mouse click (within the tolerance setting) will snap to that layer.
Measure Area: Areas can also be measured. In the
measure window, the accumulated area size appears. In addition, the measuring
tool will snap to the currently selected layer, provided that layer has its
snapping tolerance set (see section Définir le rayon de tolérance d’accrochage et de recherche). So, if you want
to measure exactly along a line feature, or around a polygon feature, first set
its snapping tolerance, then select the layer. Now, when using the measuring
tools, each mouse click (within the tolerance setting) will snap to that layer.
Figure Measure 2:
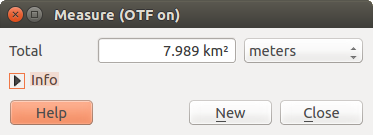
Measure Area (Gnome)
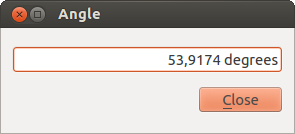
 Measure Angle: You can also measure angles. The
cursor becomes cross-shaped. Click to draw the first segment of the angle you
wish to measure, then move the cursor to draw the desired angle. The measure
is displayed in a pop-up dialog.
Measure Angle: You can also measure angles. The
cursor becomes cross-shaped. Click to draw the first segment of the angle you
wish to measure, then move the cursor to draw the desired angle. The measure
is displayed in a pop-up dialog.
Figure Measure 3:
Measure Angle (Gnome)
Sélectionner et désélectionner des entités
The QGIS toolbar provides several tools to select features in the map canvas.
To select one or several features, just click on  and select your
tool:
and select your
tool:
- Select Single Feature
 Select Features by Rectangle
 Select Features by Polygon
 Select Features by Freehand
 Select Features by Radius
To deselect all selected features click on  Deselect
features from all layers.
Deselect
features from all layers.
 Select feature using an expression allow user
to select feature using expression dialog. See Expressions
chapter for some example.
Select feature using an expression allow user
to select feature using expression dialog. See Expressions
chapter for some example.
Users can save features selection into a New Memory Vector Layer or a New Vector Layer using Edit ‣ Paste Feature as ... and choose the mode you want.
Identifier les entités
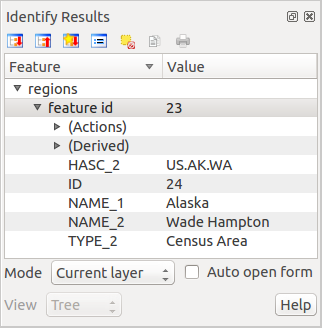
The Identify tool allows you to interact with the map canvas and get information on features
in a pop-up window. To identify features, use View ‣ Identify
features or press Ctrl + Shift + I, or click on the  Identify features icon in the toolbar.
If you click on several features, the Identify results dialog will list information about all the selected features. The first item is the number of the layer in the list of results, followed by the layer name. Then, its first child will be the name of a field with its value. The first field is the one selected in Properties ‣ Display. Finally, all information about the feature is displayed.
Cette fenêtre se personnalise pour afficher les champs choisis mais par défaut, trois types d’information sont affichés :
- Actions: Actions can be added to the identify feature windows. When clicking on the action label, action will be run. By default, only one action is added, to view feature form for editing.
- Derived: This information is calculated or derived from other information. You can find clicked coordinate, X and Y coordinates, area in map units and perimeter in map units for polygons, length in map units for lines and feature ids.
- Data attributes: This is the list of attribute fields from the data.
Figure Identify 1:
Identify feaures dialog (Gnome)
At the top of the window, you have five icons:
 Expand tree
 Collapse tree
 Default behaviour
 Copy attributes
 Print selected HTML response
At the bottom of the window, you have the Mode and View comboboxes. With the Mode combobox you can define the identify mode: ‘Current layer’, ‘Top down, stop at first’, ‘Top down’ and ‘Layer selection’. The View can be set as ‘Tree’, ‘Table’ and ‘Graph’.
The identify tool allows you to auto open a form. In this mode you can change the feautures attributes.
D’autres fonctions peuvent être trouvées dans le menu contextuel d’un élément identifié, via un clic droit. Par exemple, depuis le menu contextuel, vous pouvez :
Voir le formulaire d’entité
Zoomer sur l’entité
Copier l’entité : copie toute la géométrie et les attributs d’une entité
- Toggle feature selection: adds identified feature to selection
Copier les valeurs d’attributs : copie uniquement les valeurs d’attributs de l’entité identifiée
- Copy feature attributes: Copy only attributes
Lâcher les résultats : la fenêtre de résultats est vidée
Masquer la surbrillance : la surbrillance des entités identifiées sur la carte est retirée
Tout mettre en surbrillance
Mettre la couche en surbrillance
Activer une couche : Choisir la couche à activer
Propriétés : ouvre la fenêtre des propriétés de la couche
Tout déplier
Tout replier
Décorations
The Decorations of QGIS include the Grid, the Copyright Label, the North Arrow and the Scale Bar. They are used to ‘decorate’ the map by adding cartographic elements.
Grille
 Grille vous permet d’ajouter un graticule et des coordonnées à la carte.
Figure Decorations 1:
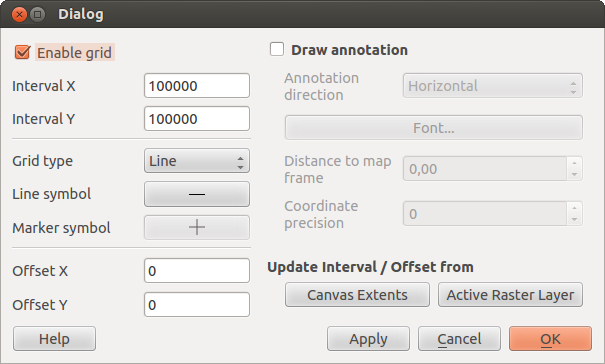
The Grid Dialog
Sélectionnez via le menu Vue ‣ Décorations ‣ Grille. La fenêtre s’affiche (voir figure_decorations_1).
Cochez la case
Activer la grille et définissez les paramètres de la grille en fonction des couches chargées dans le canevas de carte.Cochez la case
Dessiner une annotation et définissez les propriétés de l’annotation en fonction des couches chargées dans le canevas de carte.- Click [Apply] to verify that it looks as expected.
- Click [OK] to close the dialog.
Étiquette de Copyright
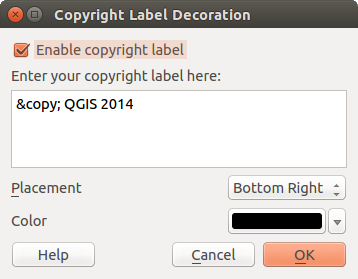
 Copyright label adds a copyright label using the text
you prefer to the map.
Copyright label adds a copyright label using the text
you prefer to the map.
Figure Decorations 2:
The Copyright Dialog
Sélectionnez via le menu Vue ‣ Décorations ‣ Étiquette de Copyright. La fenêtre s’affiche (voir figure_decorations_2).
Entrez le texte que vous souhaitez afficher sur la carte. Vous pouvez utiliser du code HTML comme le montre l’exemple.
- Choose the placement of the label from the Placement
 combo box.
 Assurez-vous que la case
Activer l’étiquette des droits d’auteur est cochée.- Click [OK].
In the example above, which is the default, QGIS places a copyright symbol followed by the date in the lower right-hand corner of the map canvas.
Flèche du nord
![]() North Arrow places a simple north arrow on the map canvas.
At present, there is only one style available. You can adjust the angle of the
arrow or let QGIS set the direction automatically. If you choose to let QGIS
determine the direction, it makes its best guess as to how the arrow should be
oriented. For placement of the arrow, you have four options, corresponding to
the four corners of the map canvas.
North Arrow places a simple north arrow on the map canvas.
At present, there is only one style available. You can adjust the angle of the
arrow or let QGIS set the direction automatically. If you choose to let QGIS
determine the direction, it makes its best guess as to how the arrow should be
oriented. For placement of the arrow, you have four options, corresponding to
the four corners of the map canvas.
Figure Decorations 3:
The North Arrow Dialog
Échelle graphique
 Scale Bar adds a simple scale bar to the map canvas. You
can control the style and placement, as well as the labeling of the bar.
Scale Bar adds a simple scale bar to the map canvas. You
can control the style and placement, as well as the labeling of the bar.
Figure Decorations 4:
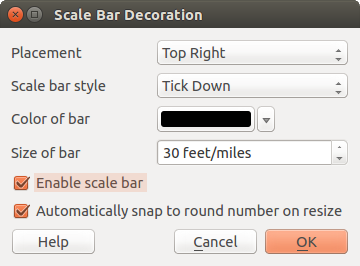
The Scale Bar Dialog
QGIS only supports displaying the scale in the same units as your map frame. So if the units of your layers are in meters, you can’t create a scale bar in feet. Likewise, if you are using decimal degrees, you can’t create a scale bar to display distance in meters.
Pour ajouter une échelle graphique :
Sélectionnez le menu Vue ‣ Décorations ‣ Échelle graphique. Une fenêtre s’affiche (voir figure_decorations_4).
- Choose the placement from the Placement combo box.
- Choose the style from the Scale bar style
combo box.
- Select the color for the bar Color of bar
 or use
the default black color.
or use
the default black color. - Set the size of the bar and its label Size of bar
 .
. Assurez-vous que la case
Activer l’échelle graphique est cochée.- Optionally, check Automatically snap to round number
on resize.
- Click [OK].
Astuce
Paramètre des décorations
Lorsque vous sauvegardez un projet .qgs, toutes modifications faites sur le Carroyage, la Flèche du Nord, la Barre d’Échelle et le Copyright seront sauvées dans le fichier de projet et restaurées à la prochaine ouverture du projet.
Outils d’annotation
The  Text Annotation tool in the attribute
toolbar provides the possibility to place formatted text in a balloon on the
QGIS map canvas. Use the Text Annotation tool and click into the
map canvas.
Text Annotation tool in the attribute
toolbar provides the possibility to place formatted text in a balloon on the
QGIS map canvas. Use the Text Annotation tool and click into the
map canvas.
Figure annotation 1:
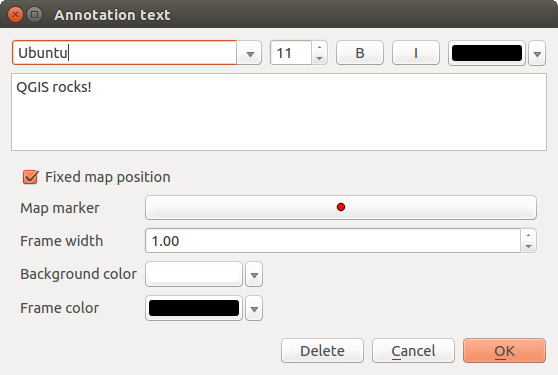
Annotation text dialog
Un double clic sur l’annotation ouvre une fenêtre avec diverses options. Il y a un éditeur de texte pour entrer du texte formaté et d’autres options notamment la possibilité de figer la position de l’annotation dans la carte (montré par un symbole de marqueur) ou d’avoir la position de l’annotation relativement à l’écran (non liée à la carte). La position de l’élément peut être déplacé sur la carte (en déplaçant le marqueur de carte) ou en déplaçant seulement la bulle. Les icônes font partie du thème SIG et sont utilisées par défaut dans les autres thèmes, aussi.
The  Move Annotation tool allows you to move the
annotation on the map canvas.
Move Annotation tool allows you to move the
annotation on the map canvas.
Annotations HTML
The  Html Annotation tools in the attribute
toolbar provides the possibility to place the content of an html file in a
balloon on the QGIS map canvas. Using the Html Annotation tool, click
into the map canvas and add the path to the html file into the dialog.
Html Annotation tools in the attribute
toolbar provides the possibility to place the content of an html file in a
balloon on the QGIS map canvas. Using the Html Annotation tool, click
into the map canvas and add the path to the html file into the dialog.
Annotations SVG
The  SVG Annotation tool in the attribute toolbar
provides the possibility to place an SVG symbol in a balloon on the QGIS map
canvas. Using the SVG Annotation tool, click into the map canvas and
add the path to the SVG file into the dialog.
SVG Annotation tool in the attribute toolbar
provides the possibility to place an SVG symbol in a balloon on the QGIS map
canvas. Using the SVG Annotation tool, click into the map canvas and
add the path to the SVG file into the dialog.
Formulaire d’annotation
Additionally, you can also create your own annotation forms. The
Form Annotation tool is useful to display
attributes of a vector layer in a customized Qt Designer form (see
figure_custom_annotation). This is similar to the designer forms for the
Identify features tool, but displayed in an annotation item.
Also see this video https://www.youtube.com/watch?v=0pDBuSbQ02o from
Tim Sutton for more information.
Figure annotation 2:
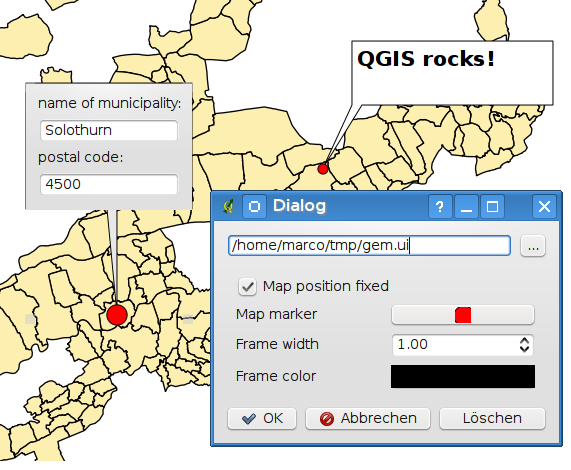
Customized qt designer annotation form
Note
Si vous pressez les touches Ctrl+T alors que l’outil Annotation est activé (déplacement d’annotation, annotation de texte ou formulaire d’annotation), les annotations sont automatiquement cachées ou, inversement, rendues visibles.
Signets spatiaux
Spatial Bookmarks allow you to “bookmark” a geographic location and return to it later.
Créer un signet
Pour créer un signet :
Déplacez-vous sur la zone concernée.
- Select the menu option View ‣ New Bookmark or press Ctrl-B.
Entrez un nom pour décrire le signet (jusqu’à 255 caractères).
- Press Enter to add the bookmark or [Delete] to remove the bookmark.
Notez que vous pouvez avoir plusieurs signets portant le même nom.
Travailler avec les signets
To use or manage bookmarks, select the menu option View ‣ Show Bookmarks. The Geospatial Bookmarks dialog allows you to zoom to or delete a bookmark. You cannot edit the bookmark name or coordinates.
Zooming to a Bookmark
From the Geospatial Bookmarks dialog, select the desired bookmark by clicking on it, then click [Zoom To]. You can also zoom to a bookmark by double-clicking on it.
Deleting a Bookmark
To delete a bookmark from the Geospatial Bookmarks dialog, click on it, then click [Delete]. Confirm your choice by clicking [Yes], or cancel the delete by clicking [No].
Import or export a bookmark
To share or transfer your bookmarks between computers you can use the Share pull down menu in the Geospatial Bookmarks dialog.
Inclusion de projets
Si vous souhaitez inclure dans votre projet QGIS des couches ou des groupes de couches issus d’un autre projet, utilisez le menu Couches ‣ Intégrer des couches et des groupes.
Intégrer des couches
La fenêtre suivante vous permet d’intégrer des couches provenant d’autres projets QGIS :
- Press
 to look for another project from the Alaska dataset.
 - Select the project file grassland. You can see the content of the project (see figure_embed_dialog).
- Press Ctrl and click on the layers grassland and regions. Press [OK]. The selected layers are embedded in the map legend and the map view now.
Figure Nesting 1:
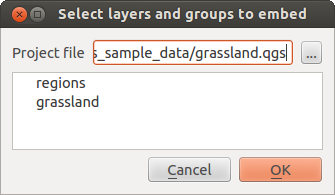
Select layers and groups to embed
Bien que les couches intégrées soient éditables, vous ne pouvez pas en modifier le style et l’étiquetage.
Supprimer des couches intégrées
Right-click on the embedded layer and choose  Remove.