ヒートマッププラグイン
`ヒートマップ`プラグインは、カーネル密度評価法を使って、入力したポイントベクタレイヤから密度(ヒートマップ)ラスタを作成します。 この密度は、より大きな値が得られるクラスタ化されたポイントで、ある位置におけるポイント数をもとに算出されます。ヒートマップは、「ホットスポット」と点のクラスタリングを容易に識別できます。
ヒートマッププラグインの有効化
このコアプラグインはプラグインマネージャ ( QGIS コアプラグインのロード のセクションを参照)を使って有効にする必要があります。それからヒートマップアイコン|heatmap| が有効になったこと、:menuselection:`ラスタ –> ヒートマップ`メニュー をラスタツールバーで確認できます。
ラスタツールバーが表示されない場合は :menuselection:`表示 –> ツールバー –> ラスタ`を選択してツールバーを表示しましょう。
ヒートマッププラグインの利用
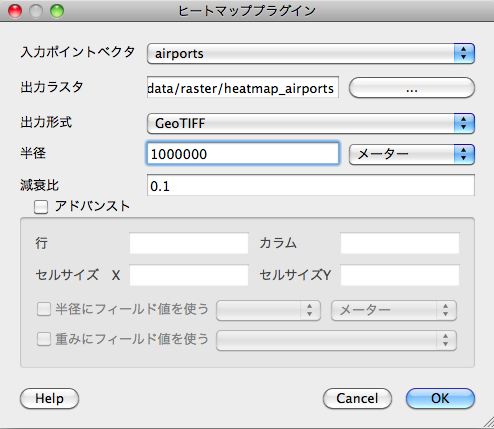
 `ヒートマップ`ツールボタンをクリックし、ヒートマッププラグインダイアログ (figure_heatmap_2 を参照)を開きます。
ダイアログには次のオプションがあります:
入力ポイントレイヤ: カレントプロジェクト内の すべてのベクタポイントレイヤのリストであり、選択したレイヤが分析に使われます。
出力ラスタ: |browsebutton|ボタンを使用して、ヒートマッププラグインで生成する出力ラスタのフォルダとファイル名を選択します。ファイルの拡張子は必要ありません。
出力形式: 出力形式を選択して下さい. GDALでサポートされているすべての形式が選択できます, 多くの場合 GeoTIFF がもっとも適している形式です.
- Radius: used to specify the heatmap search radius (or kernel bandwidth) in meters or map units. The radius specifies the distance around a point at which the influence of the point will be felt. Larger values result in greater smoothing, but smaller values may show finer details and variation in point density.
When the  Advanced checkbox is checked additional options
will be available:
- Rows and Columns: used to change the dimensions of the output raster. These values are also linked to the Cell size X and Cell size Y values. Increasing the number of rows or colums will decrease the cell size and increase the file size of the output file. The values in Rows and Columns are also linked, so doubling the number of rows will automatically double the number of columns and the cell sizes will also be halved. The geographical area of the output raster will remain the same!
- Cell size X and Cell size Y: control the geographic size of each pixel in the output raster. Changing these values will also change the number of Rows and Columns in the output raster.
- Kernel shape: The kernel shape controls the rate at which the influence of a point decreases as the distance from the point increases. Different kernels decay at different rates, so a triweight kernel gives features greater weight for distances closer to the point then the Epanechnikov kernel does. Consequently, triweight results in “sharper” hotspots, and Epanechnikov results in “smoother” hotspots. A number of standard kernel functions are available in QGIS, which are described and illustrated on Wikipedia.
- Decay ratio: can be used with Triangular kernels to futher control how heat from
a feature decreases with distance from the feature.
- A value of 0 (=minimum) indicates that the heat will be concentrated in the centre of the given radius and be completely extinguished at the edge.
- A value of 0.5 indicates that pixels at the edge of the radius will be given half the heat as pixels at the centre of the search radius.
- A value of 1 means the heat is spread evenly over the whole search radius circle. (This is equivalent to the ‘Uniform’ kernel.)
- A value greater than 1 indicates that the heat is higher towards the edge of the search radius then at the centre.
The input point layer may also have attribute fields which can affect how they influence the heatmap:
- Use radius from field: sets the search radius for each feature from an attribute field in the input layer.
- Use weight from field: allows input features to be weighted by an attribute field. This can be used to increase the influence certain features have on the resultant heatmap.
When an output raster file name is specified, the [OK] button can be used to create the heatmap.
Tutorial: Creating a Heatmap
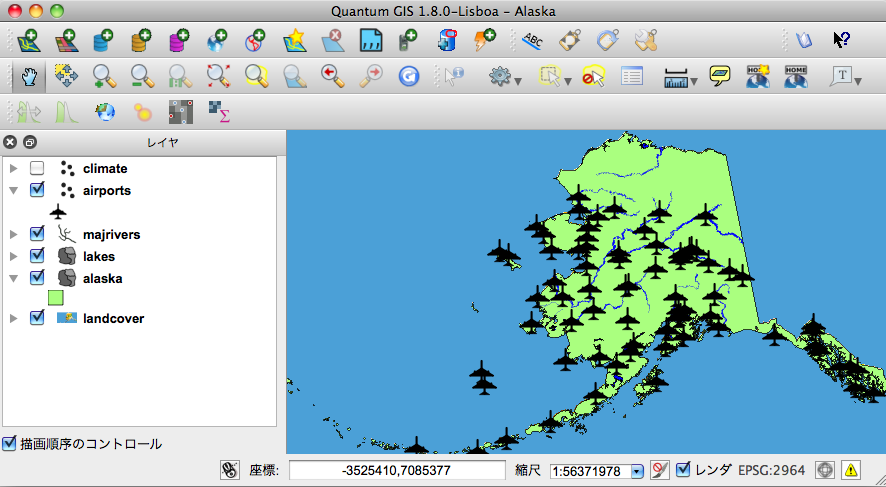
For the following example we will use the airports vector point layer from
the QGIS sample dataset (see サンプルデータ). Another exellent QGIS
tutorial on making heatmaps can be found at http://qgis.spatialthoughts.com.
Figure_Heatmap_1 ではアラスカの空港が示されてます。
Figure Heatmap 1:
- Select the
 Heatmap toolbutton to open the Heatmap dialog
(see Figure_Heatmap_2).
 - In the Input point layer
 field select
 airportsfrom the list of point layers loaded in current project. - Specify an output file name by clicking the
 button next to the
Output raster field. Enter the file name
 heatmap_airports(no file extension is necessary). - Leave the Output format as the default format,
GeoTIFF. - Change the Radius to
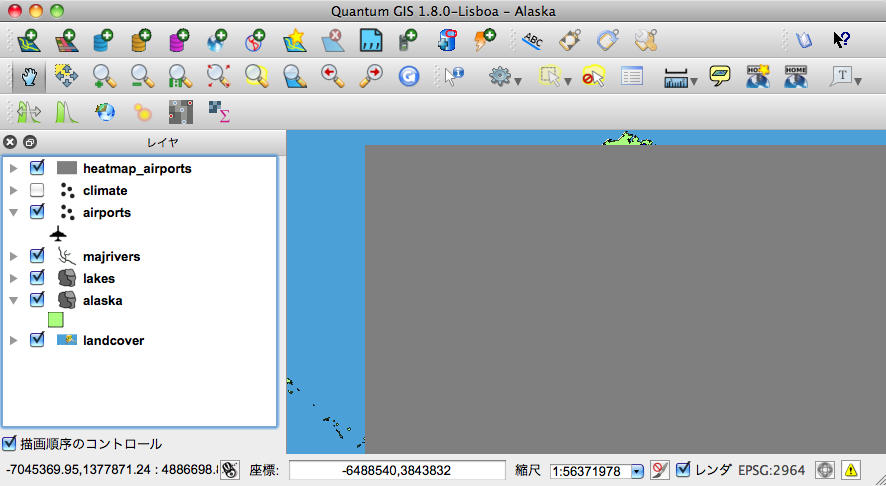
1000000meters. - Click on [OK] to create and load the airports heatmap (see Figure_Heatmap_3).
Figure Heatmap 2:
QGIS will generate the heatmap and add the results to your map window. By default, the heatmap is shaded in greyscale, with lighter areas showing higher concentrations of airports. The heatmap can now be styled in QGIS to improve its appearance.
Figure Heatmap 3:
- Open the properties dialog of the
heatmap_airportslayer (select the layerheatmap_airports, open the context menu with the right mouse button and select Properties). - Select the Style tab.
- Change the Render type
 to ‘Singleband pseudocolor’.
 - Select a suitable Color map
 , for instance
 YlOrRed. - Click the [Load] button to fetch the minimum and maximum values from the raster, then click the [Classify] button.
- Press [OK] to update the layer.
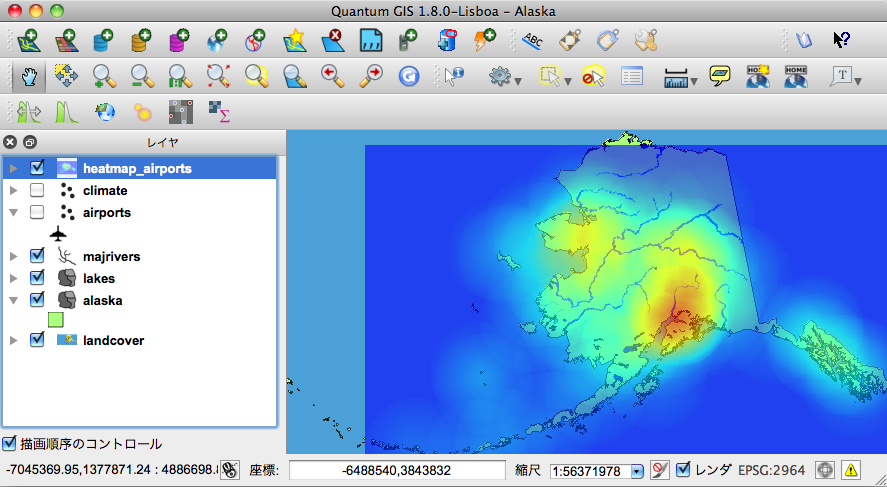
最終的な結果はFigure_Heatmap_4 に示してあります。
Figure Heatmap 4:


