.
Модуль «Теплокарт໶
Модуль «Создание теплокарт» использует ядерную оценку плотности распределения для создания растровой карты плотности (теплокарты) по исходному точечному векторному слою. Плотность вычисляется по числу точек в определенной области, больше количество точек даёт большее значение плотности. Теплокарты позволяют легко идентифицировать скопления точек и выявлять «горячие» области.
Активация модуля
First this core plugin needs to be activated using the Plugin Manager (see
load_core_plugin). After activation, the heatmap icon  can be found in the Raster Toolbar, and under the Raster ‣ Heatmap
menu.
Если кнопки не видно, возможно, у вас отключена соответствующая панель инструментов. Включить её можно из меню Вид ‣ Панели инструментов ‣ Растр.
Использование модуля
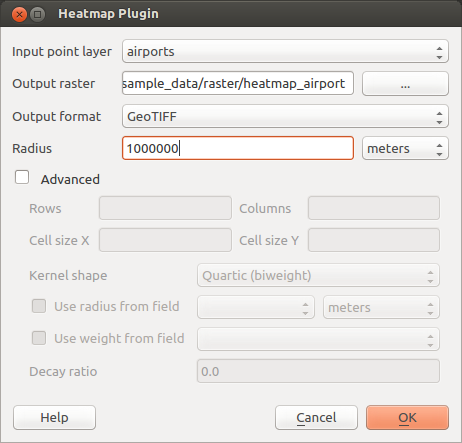
Clicking the  Heatmap tool button opens the Heatmap plugin dialog
(see figure_heatmap_2).
Для построения теплокарты необходимо задать следующие параметры:
- Input point layer: Lists all the vector point layers in the current project and is used to select the layer to be analysed.
- Output raster: Allows you to use the
 button to select the folder and
filename for the output raster the Heatmap plugin generates. A file extension
is not required.
 - Output format: Selects the output format. Although all formats supported by GDAL can be choosen, in most cases GeoTIFF is the best format to choose.
- Radius: Is used to specify the heatmap search radius (or kernel bandwidth) in meters or map units. The radius specifies the distance around a point at which the influence of the point will be felt. Larger values result in greater smoothing, but smaller values may show finer details and variation in point density.
When the  Advanced checkbox is checked, additional options
will be available:
- Rows and Columns: Used to change the dimensions of the output raster. These values are also linked to the Cell size X and Cell size Y values. Increasing the number of rows or columns will decrease the cell size and increase the file size of the output file. The values in Rows and Columns are also linked, so doubling the number of rows will automatically double the number of columns and the cell sizes will also be halved. The geographical area of the output raster will remain the same!
- Cell size X and Cell size Y: Control the geographic size of each pixel in the output raster. Changing these values will also change the number of Rows and Columns in the output raster.
Функция ядра: задаёт алгоритм по которому рассчитывается знижение влияния точки по мере увеличения расстояния от неё. Разные функции имеют разные коэффициенты уменьшения, поэтому тривесовая функция даёт больший вес на малых расстояниях от точки чем функция Евпанечникова. И как результат, тривесовая функция делает «горячие» точки более четкими, а функция Евпанечникова — сглаженными. В QGIS доступны основные функции ядра, описание которых можно найти в Википедии.
- Decay ratio: Can be used with Triangular kernels to further control how heat from
a feature decreases with distance from the feature.
- A value of 0 (=minimum) indicates that the heat will be concentrated in the centre of the given radius and completely extinguished at the edge.
Коэффициент равный 0.5 означает, что температура пикселей на краях буферной зоны будет в два раза ниже температуры в центре.
Если указано значение 1, распределение температуры будет равномерным по всей буферной зоне (это равнозначно использованию «Прямоугольной» функции ядра).
- A value greater than 1 indicates that the heat is higher towards the edge of the search radius than at the centre.
Исходный точечный слой может содержать поля, которые можно использоваться при построении теплокарты:
- Use radius from field: Sets the search radius for each feature from an attribute field in the input layer.
- Use weight from field: Allows input features to be weighted by an attribute field. This can be used to increase the influence certain features have on the resultant heatmap.
Когда все параметры указаны, нажмите кнопку [OK], чтобы запустить процесс создания теплокарты.
Пример создания теплокарты
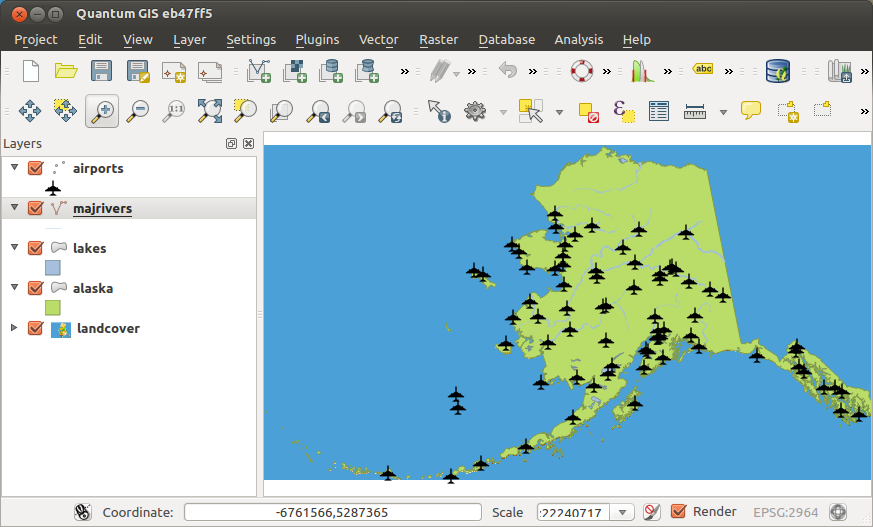
For the following example, we will use the airports vector point layer from the QGIS sample dataset (see Примеры данных). Another exellent QGIS tutorial on making heatmaps can be found at http://qgis.spatialthoughts.com.
In Figure_Heatmap_1, the airports of Alaska are shown.
Figure Heatmap 1:
- Select the
 Heatmap tool button to open the Heatmap dialog
(see Figure_Heatmap_2).
 - In the Input point layer
 field, select airports
from the list of point layers loaded in the current project.
 - Specify an output filename by clicking the
 button next to the
Output raster field. Enter the filename heatmap_airports (no
file extension is necessary).
 Установите в поле Радиус значение 1000000 метров.
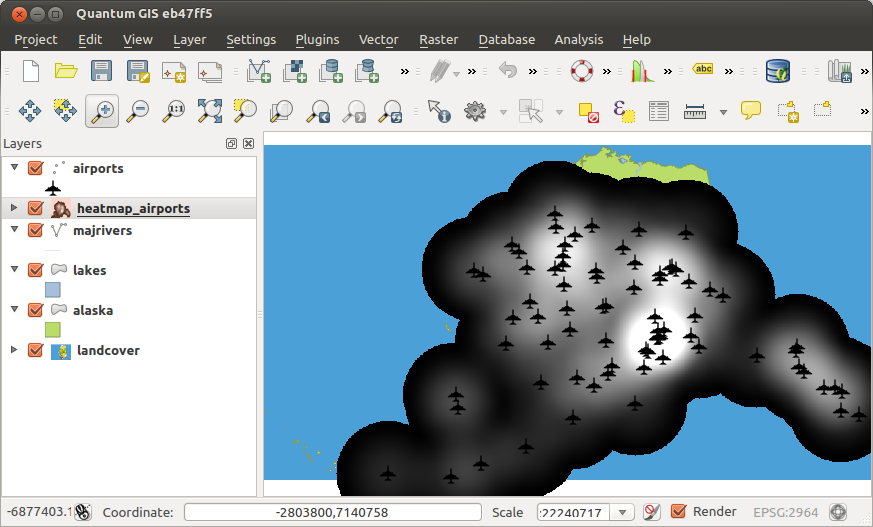
Нажмите кнопку [OK] чтобы создать и загрузить в QGIS теплокарту (см. рисунок Figure_Heatmap_3).
Figure Heatmap 2:
QGIS создаст теплокарту и загрузить её в проект. По умолчанию итоговый растр отображается в оттенках серого цвета, светлым областям соответствует болбшая концентрация аэропортов. Чтобы теплокарта была легкочитаемой рекомендуется изменить её стиль отображения. с использованием правильного стиля
Figure Heatmap 3:
Откройте свойства слоя heatmap_airports. Для этого выберите слой в списке слоёв проекта, вызовите контекстное меню по правой клавише мыши и выберите пункт Свойства.
Перейдите на вкладку Стиль.
Измените стиль отрисовки в поле Изображение
 с «Одноканальное серое» на «Одноканальное псевдоцветное».
Выберите подходящую цветовую карту в группе Создать цветовую карту, например «YlOrRed».
Нажмите кнопку [Загрузить]**в группе :guilabel:`Значения мин/макс` для получения минимального и максимального значений растра. Затем нажмите кнопку **[Классифицировать] в группе Создать цветовую карту.
Нажмите кнопку [OK] чтобы закрыть окно и применить настройки отображения растра.
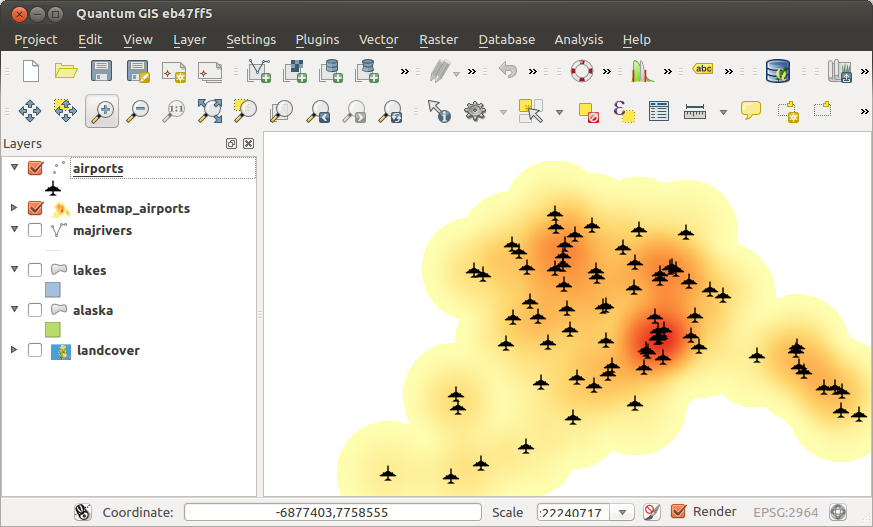
Конечный результат показан на рисунке Figure_Heatmap_4.
Figure Heatmap 4:


