.
Ferramentas gerais
Atalhos do teclado
QGIS provides default keyboard shortcuts for many features. You can find them in section Barra de Menus. Additionally, the menu option Settings ‣ Configure Shortcuts.. allows you to change the default keyboard shortcuts and to add new keyboard shortcuts to QGIS features.
Figure Shortcuts 1:

Define shortcut options  (Gnome)
Configuration is very simple. Just select a feature from the list and click on [Change], [Set none] or [Set default]. Once you have finished your configuration, you can save it as an XML file and load it to another QGIS installation.
Ajuda de contexto
When you need help on a specific topic, you can access context help via the [Help] button available in most dialogs — please note that third-party plugins can point to dedicated web pages.
Renderização
By default, QGIS renders all visible layers whenever the map canvas is refreshed. The events that trigger a refresh of the map canvas include:
Adicionando uma camada
Movendo e ampliando
- Resizing the QGIS window
Mudar a visibilidade da camada ou camadas
O QGIS permite que possa controlar o processo de renderização de várias formas.
Renderização Dependente da Escala
Scale-dependent rendering allows you to specify the minimum and maximum scales
at which a layer will be visible. To set scale-dependent rendering, open the
Properties dialog by double-clicking on the layer in the legend. On
the General tab, click on the  Scale
dependent visibility checkbox to activate the feature, then set the minimum and
maximum scale values.
Scale
dependent visibility checkbox to activate the feature, then set the minimum and
maximum scale values.
Pode determinar os valores da escala em primeiro lugar aumentando a um nível que quer usar e não ter valores de escala na barra de estado do QGIS.
Controlando a Renderização do Mapa
A renderização do mapa pode ser controlada de várias maneiras, como é descrito em baixo.
Suspendendo a Renderização
To suspend rendering, click the Render checkbox in the
lower right corner of the status bar. When the Render
checkbox is not checked, QGIS does not redraw the canvas in response to any of
the events described in section Renderização. Examples of when you
might want to suspend rendering include:
- Adding many layers and symbolizing them prior to drawing
- Adding one or more large layers and setting scale dependency before drawing
- Adding one or more large layers and zooming to a specific view before drawing
Qualquer combinação acima
A activação da caixa de verificação Renderização permite a renderização e actualização imediata do enquadramento do mapa.
Setting Layer Add Option
You can set an option to always load new layers without drawing them. This
means the layer will be added to the map, but its visibility checkbox in the
legend will be unchecked by default. To set this option, choose menu option
Settings ‣ Options and click on the Rendering
tab. Uncheck the By default new layers added to the map
should be displayed checkbox. Any layer subsequently added to the map will be off
(invisible) by default.
Terminando Renderização
To stop the map drawing, press the ESC key. This will halt the refresh of the map canvas and leave the map partially drawn. It may take a bit of time between pressing ESC and the time the map drawing is halted.
Note
It is currently not possible to stop rendering — this was disabled in the Qt4 port because of User Interface (UI) problems and crashes.
Atualizando a Visualização do Mapa Durante a Renderização
You can set an option to update the map display as features are drawn. By default, QGIS does not display any features for a layer until the entire layer has been rendered. To update the display as features are read from the datastore, choose menu option Settings ‣ Options and click on the Rendering tab. Set the feature count to an appropriate value to update the display during rendering. Setting a value of 0 disables update during drawing (this is the default). Setting a value too low will result in poor performance, as the map canvas is continually updated during the reading of the features. A suggested value to start with is 500.
Influência da Qualidade de Renderização
To influence the rendering quality of the map, you have two options. Choose menu option Settings ‣ Options, click on the Rendering tab and select or deselect following checkboxes:
- Make lines appear less jagged at the expense of some
drawing performance
- Fix problems with incorrectly filled polygons
Acelerar a renderização
There are two settings that allow you to improve rendering speed. Open the QGIS options dialog using Settings ‣ Options, go to the Rendering tab and select or deselect the following checkboxes:
- Enable back buffer. This provides better graphics
performance at the cost of losing the possibility to cancel rendering and
incrementally draw features. If it is unchecked, you can set the
Number of features to draw before updating the display, otherwise
this option is inactive.
- Use render caching where possible to speed up redraws
Medindo
Measuring works within projected coordinate systems (e.g., UTM) and unprojected data. If the loaded map is defined with a geographic coordinate system (latitude/longitude), the results from line or area measurements will be incorrect. To fix this, you need to set an appropriate map coordinate system (see section Trabalhando com Projecções). All measuring modules also use the snapping settings from the digitizing module. This is useful, if you want to measure along lines or areas in vector layers.
Para seleccionar a ferramenta de medição, clique em  e seleccione a ferramenta que quer usar.
Medir comprimentos, áreas e ângulos
Measure Line: QGIS is able to measure real distances
between given points according to a defined ellipsoid. To configure this,
choose menu option Settings ‣ Options, click on the
Map tools tab and select the appropriate ellipsoid. There, you can
also define a rubberband color and your preferred measurement units (meters or
feet) and angle units (degrees, radians and gon). The tool then allows you to
click points on the map. Each segment length, as well as the total, shows up in
the measure window. To stop measuring, click your right mouse button.
Figure Measure 1:

Measure Distance (Gnome)
 Measure Area: Areas can also be measured. In the
measure window, the accumulated area size appears. In addition, the measuring
tool will snap to the currently selected layer, provided that layer has its
snapping tolerance set (see section Configurando a Tolerância de Atracção e Raio de Pesquisa). So, if you want
to measure exactly along a line feature, or around a polygon feature, first set
its snapping tolerance, then select the layer. Now, when using the measuring
tools, each mouse click (within the tolerance setting) will snap to that layer.
Measure Area: Areas can also be measured. In the
measure window, the accumulated area size appears. In addition, the measuring
tool will snap to the currently selected layer, provided that layer has its
snapping tolerance set (see section Configurando a Tolerância de Atracção e Raio de Pesquisa). So, if you want
to measure exactly along a line feature, or around a polygon feature, first set
its snapping tolerance, then select the layer. Now, when using the measuring
tools, each mouse click (within the tolerance setting) will snap to that layer.
Figure Measure 2:

Measure Area (Gnome)
 Measure Angle: You can also measure angles. The
cursor becomes cross-shaped. Click to draw the first segment of the angle you
wish to measure, then move the cursor to draw the desired angle. The measure
is displayed in a pop-up dialog.
Measure Angle: You can also measure angles. The
cursor becomes cross-shaped. Click to draw the first segment of the angle you
wish to measure, then move the cursor to draw the desired angle. The measure
is displayed in a pop-up dialog.
Figure Measure 3:

Measure Angle (Gnome)
Selecionar e desselecionar elementos
A caixa de ferramentas QGIS fornece várias ferramentas para seleccionar elementos no enquadramento do mapa. Para seleccionar um ou mais elementos, simplesmente clique em  e seleccione a sua ferramenta:
- Seleccionar Elemento Único
 Seleccionar Elementos por Rectângulo
 Seleccionar Elementos por Polígono
 Seleccionar Elementos por Delimitação Livre
 Seleccionar Elementos pelo Raio
To deselect all selected features click on  Deselect
features from all layers.
Deselect
features from all layers.
Identificar elementos
The Identify tool allows you to interact with the map canvas and get information on features
in a pop-up window. To identify features, use View ‣ Identify
features or press Ctrl + Shift + I, or click on the  Identify features icon in the toolbar.
If you click on several features, the Identify results dialog will list information about all the selected features. The first item is the number of the feature in the list of results, followed by the layer name. Then, its first child will be the name of a field with its value. Finally, all information about the feature is displayed.
Esta janela pode ser personalizada para exibir campos personalizados, mas por defeito irá exibir três tipos de informação:
Acções: Acções podem ser adicionadas à janela de indentificação de elementos. Quando clica no rótulo de acção, uma acção correrá. Por defeito, apenas uma acção é adicionada, que é ver o formulário do elemento em modo edição.
- Derived: This information is calculated or derived from other information. You can find clicked coordinate, X and Y coordinates, area in map units and perimeter in map units for polygons, length in map units for lines and feature ids.
- Data attributes: This is the list of attribute fields from the data.
Figure Identify 1:

Diálogo de Identificar elementos (Gnome)
No fundo da janela, tem cinco ícones:
 Expand tree
 Collapse tree
 Default behaviour
 Copiar atributos
 Print selected HTML response
Outras funções podem ser encontradas no menu de contexto do item identificado. Por exemplo, a partir do menu de contexto poderá:
Ver o formulário do elemento
Aproximar ao elemento
Copiar elemento:Copiar todas as geometrias do elemento e atributos
Copiar o valor do atributo: Copia apenas o valor do atributo que clicou
- Copy feature attributes: Copy only attributes
Limpar resultado: remove os resultados na janela
- Clear highlights: Remove features highlighted on the map
Destacar todos
Destacar camada
- Activate layer: Choose a layer to be activated
Propriedades da camada: Abre a janela das propriedades da camada
Expandir todos
Fechar todos
Decorações
The Decorations of QGIS include the Grid, the Copyright Label, the North Arrow and the Scale Bar. They are used to ‘decorate’ the map by adding cartographic elements.
Grelha
 Grid allows you to add a coordinate grid and coordinate
annotations to the map canvas.
Grid allows you to add a coordinate grid and coordinate
annotations to the map canvas.
Figure Decorations 1:

Janela da Grelha
Seleccione a partir do menu Ver ‣ Decorações ‣ Grelha. A janela de diálogo inicia. (veja figure_decorations_1).
- Activate the Enable grid checkbox and set grid
definitions according to the layers loaded in the map canvas.
- Activate the Draw annotations checkbox and set
annotation definitions according to the layers loaded in the map canvas.
Clique [Aplicar] para verificar se tudo está como o esperado.
Clique [OK] para fechar a janela de diálogo.
Etiqueta de Direitos de autor
 Copyright label adds a copyright label using the text
you prefer to the map.
Copyright label adds a copyright label using the text
you prefer to the map.
Figure Decorations 2:
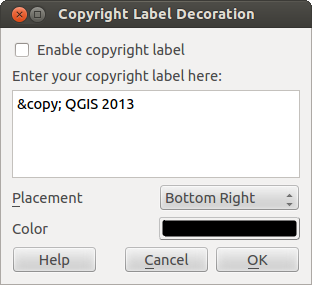
The Copyright Dialog
Seleccione a partir do menu Ver ‣ Decorações ‣ Etiqueta Copyright. O diálogo iniciará (veja figure_decorations_2).
- Enter the text you want to place on the map. You can use HTML as shown in the example.
- Choose the placement of the label from the Placement
 combo box.
 - Make sure the Enable Copyright Label checkbox is
checked.
Clique [OK].
In the example above, which is the default, QGIS places a copyright symbol followed by the date in the lower right-hand corner of the map canvas.
Seta do Norte
![]() North Arrow places a simple north arrow on the map canvas.
At present, there is only one style available. You can adjust the angle of the
arrow or let QGIS set the direction automatically. If you choose to let QGIS
determine the direction, it makes its best guess as to how the arrow should be
oriented. For placement of the arrow, you have four options, corresponding to
the four corners of the map canvas.
North Arrow places a simple north arrow on the map canvas.
At present, there is only one style available. You can adjust the angle of the
arrow or let QGIS set the direction automatically. If you choose to let QGIS
determine the direction, it makes its best guess as to how the arrow should be
oriented. For placement of the arrow, you have four options, corresponding to
the four corners of the map canvas.
Figure Decorations 3:
Diálogo da Seta do Norte
Barra de Escala
 Scale Bar adds a simple scale bar to the map canvas. You
can control the style and placement, as well as the labeling of the bar.
Scale Bar adds a simple scale bar to the map canvas. You
can control the style and placement, as well as the labeling of the bar.
Figure Decorations 4:

Diálogo da Barra de Escala
QGIS only supports displaying the scale in the same units as your map frame. So if the units of your layers are in meters, you can’t create a scale bar in feet. Likewise, if you are using decimal degrees, you can’t create a scale bar to display distance in meters.
Para adicionar a barra de escala:
- Select from menu View ‣ Decorations ‣ Scale Bar. The dialog starts (see figure_decorations_4).
- Choose the placement from the Placement combo box.
- Choose the style from the Scale bar style
combo box.
- Select the color for the bar Color of bar
 or use
the default black color.
or use
the default black color. - Set the size of the bar and its label Size of bar
 .
. - Make sure the Enable scale bar checkbox is checked.
- Optionally, check Automatically snap to round number
on resize.
Clique [OK].
Tip
Separador das Decorações
When you save a .qgs project, any changes you have made to Grid, North Arrow, Scale Bar and Copyright will be saved in the project and restored the next time you load the project.
Ferramentas de Anotação
The  Text Annotation tool in the attribute
toolbar provides the possibility to place formatted text in a balloon on the
QGIS map canvas. Use the Text Annotation tool and click into the
map canvas.
Text Annotation tool in the attribute
toolbar provides the possibility to place formatted text in a balloon on the
QGIS map canvas. Use the Text Annotation tool and click into the
map canvas.
Figure annotation 1:

Diálogo do texto de anotação
Double clicking on the item opens a dialog with various options. There is the text editor to enter the formatted text and other item settings. For instance, there is the choice of having the item placed on a map position (displayed by a marker symbol) or to have the item on a screen position (not related to the map). The item can be moved by map position (by dragging the map marker) or by moving only the balloon. The icons are part of the GIS theme, and they are used by default in the other themes, too.
The  Move Annotation tool allows you to move the
annotation on the map canvas.
Move Annotation tool allows you to move the
annotation on the map canvas.
Anotações Html
The  Html Annotation tools in the attribute
toolbar provides the possibility to place the content of an html file in a
balloon on the QGIS map canvas. Using the Html Annotation tool, click
into the map canvas and add the path to the html file into the dialog.
Html Annotation tools in the attribute
toolbar provides the possibility to place the content of an html file in a
balloon on the QGIS map canvas. Using the Html Annotation tool, click
into the map canvas and add the path to the html file into the dialog.
Anotações SVG
The  SVG Annotation tool in the attribute toolbar
provides the possibility to place an SVG symbol in a balloon on the QGIS map
canvas. Using the SVG Annotation tool, click into the map canvas and
add the path to the SVG file into the dialog.
SVG Annotation tool in the attribute toolbar
provides the possibility to place an SVG symbol in a balloon on the QGIS map
canvas. Using the SVG Annotation tool, click into the map canvas and
add the path to the SVG file into the dialog.
Formulários de anotações
Additionally, you can also create your own annotation forms. The
Form Annotation tool is useful to display
attributes of a vector layer in a customized Qt Designer form (see
figure_custom_annotation). This is similar to the designer forms for the
Identify features tool, but displayed in an annotation item.
Also see this video https://www.youtube.com/watch?v=0pDBuSbQ02o from
Tim Sutton for more information.
Figure annotation 2:

Formulário de anotação personalizado no Qt Designer
Note
Se clicar Ctrl+T enquanto a ferramenta Anotação é activada (move a anotação, anotação de texto, formulário da anotação), o estado de visibilidade desses itens são invertidos.
Marcadores espaciais
Marcadores espaciais permite-lhe “marcar” uma localização geográfica e voltar a ele mais tarde.
Criando um Marcador
Para criar um marcador:
Aproximar ou mover para uma área de interesse.
Seleccione a opção do menu Ver ‣ Novo Marcador ou carregue Ctrl-B.
Introduza um nome descritivo para o marcador (até 255 caracteres).
Pressione Enter para adicionar o marcador ou [Apagar] para remover o marcador.
Repare que tem múltiplos marcadores com o mesmo nome.
Trabalhando com Marcadores
To use or manage bookmarks, select the menu option View ‣ Show Bookmarks. The Geospatial Bookmarks dialog allows you to zoom to or delete a bookmark. You cannot edit the bookmark name or coordinates.
Aproximando a um Marcador
From the Geospatial Bookmarks dialog, select the desired bookmark by clicking on it, then click [Zoom To]. You can also zoom to a bookmark by double-clicking on it.
Apagando um Marcador
To delete a bookmark from the Geospatial Bookmarks dialog, click on it, then click [Delete]. Confirm your choice by clicking [Yes], or cancel the delete by clicking [No].
Nesting Projects
If you want to embed content from other project files into your project, you can choose Layer ‣ Embed Layers and Groups.
Embebendo camadas
A seguinte janela permite que possa embeber camadas de outros projectos. Aqui está um pequeno exemplo:
Pressione
 para ver outro projeto a partir do conjunto de dados Alaska.
- Select the project file grassland. You can see the content of the project (see figure_embed_dialog).
- Press Ctrl and click on the layers grassland and regions. Press [OK]. The selected layers are embedded in the map legend and the map view now.
Figure Nesting 1:

Selecione as camadas e grupos para incorporar
While the embedded layers are editable, you can’t change their properties like style and labeling.
Removendo camadas embebidas
Right-click on the embedded layer and choose  Remove.