7.4. Lesson: Ruimtelijke statistieken
Notitie
Les ontwikkeld door Linfiniti en S Motala (Cape Peninsula University of Technology)
Ruimtelijke statistieken stellen u in staat te analyseren en te begrijpen wat er gaande is in een bepaalde vector gegevensset. QGIS bevat verschillende standaard gereedschappen voor statistische analyses die in dit opzicht hun nut hebben bewezen.
The goal for this lesson: To know how to use QGIS’ spatial statistics tools.
7.4.1.  Follow Along: Een test-gegevensset maken
We zullen een willekeurige verzameling van punten maken om een punt gegevensset te krijgen om mee te werken,
U heeft, om dat te doen, een polygoon gegevensset nodig die het bereik van het gebied waarin u de punten wilt maken definieert.
We zullen het gebied gebruiken dat wordt bedekt door straten.
- Create a new empty map.
- Add your
roads_34Slayer, as well as thesrtm_41_19.tifraster (elevation data) found inexercise_data/raster/SRTM/.
Notitie
You might find that your SRTM DEM layer has a different CRS to that of the roads layer. If so, you can reproject either the roads or DEM layer using techniques learnt earlier in this module.
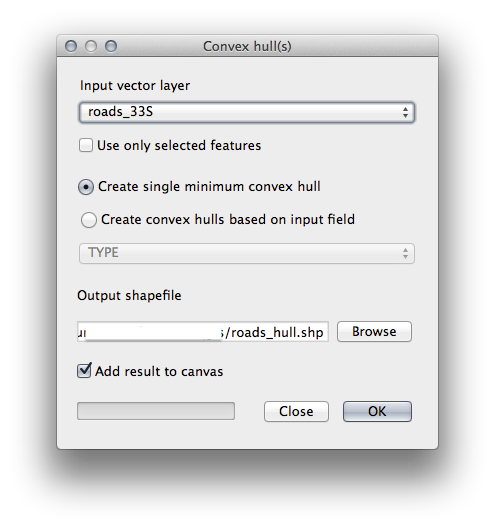
- Use the Convex hull(s) tool (available under Vector ‣ Geoprocessing Tools) to generate an area enclosing all the roads:

- Save the output under
exercise_data/spatial_statistics/asroads_hull.shp. - Check Add result to canvas option to add the output to the TOC (Layers list).
7.4.1.1. Willekeurige punten genereren
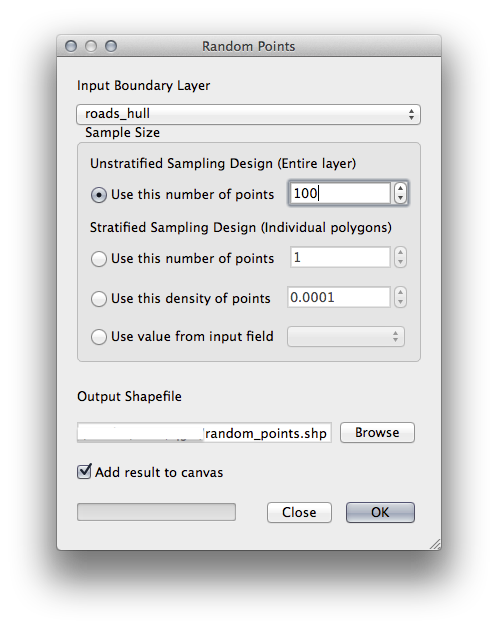
- Create random points in this area using the tool at Vector ‣ Research Tools ‣ Random points:

- Save the output under
exercise_data/spatial_statistics/asrandom_points.shp. - Check Add result to canvas option to add the output to the TOC (Layers list).

7.4.1.2. Een monster uit de gegevens
- To create a sample dataset from the raster, you’ll need to use the Point sampling tool plugin.
- Refer ahead to the module on plugins if necessary.
- Search for the phrase
point samplingin the Plugin ‣ Manage and Install Plugins... and you will find the plugin. - As soon as it has been activated with the Plugin Manager, you will find the tool under Plugins ‣ Analyses ‣ Point sampling tool:

- Select random_points as the layer containing sampling points, and the SRTM raster as the band to get values from.
- Make sure that “Add created layer to the TOC” is checked.
- Save the output under
exercise_data/spatial_statistics/asrandom_samples.shp.
Now you can check the sampled data from the raster file in the attributes
table of the random_samples layer, they will be in a column
named srtm_41_19.tif.
Een mogelijke laag voor het monster wordt hier weergegeven:

The sample points are classified by their value such that darker points are at a lower altitude.
U zult deze monster-laag gaan gebruiken voor de rest van de statistische oefeningen.
7.4.2.  Follow Along: Basisstatistieken
Nu nog de basisstatistieken voor deze laag ophalen.
- Click on the Vector ‣ Analysis Tools ‣ Basic statistics menu entry.
- In the dialog that appears, specify the random_samples layer as the source.
- Make sure that the Target field is set to
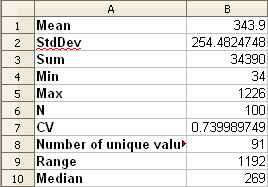
srtm_41_19.tifwhich is the field you will calculate statistics for. - Click OK. You’ll get results like this:

Notitie
You can copy and paste the results into a spreadsheet. The data uses
a (colon :) separator.

- Close the plugin dialog when done.
To understand the statistics above, refer to this definition list:
- Gemiddelde
De gemiddelde waarde is eenvoudigweg de som van de waarden, gedeeld door het aantal waarden.
- StdDev
De standaard afwijking. Geeft een indicatie over hoe dicht de waarden zijn geclusterd rondom het gemiddelde. Hoe kleiner de standaard afwijking, hoe meer waarden neigen naar het gemiddelde.
- Som
Alle waarden bij elkaar opgeteld.
- Min
De laagste waarde.
- Max
De hoogste waarde.
- N
Het aantal monsters/waarden.
- CV
- The spatial covariance of the dataset.
- Number of unique values
- The number of values that are unique across this dataset. If there are 90 unique values in a dataset with N=100, then the 10 remaining values are the same as one or more of each other.
- Bereik
Het verschil tussen de laagste en de hoogste waarden.
- Mediaan
Als u alle waarden schikt van de laagste tot de hoogste, is de middelste waarde (of het gemiddelde van de twee middelste waarden als N een even getal is) de mediaan van de waarden.
7.4.3.  Follow Along: Compute a Distance Matrix
- Create a new point layer in the same projection as the other datasets
(
WGS 84 / UTM 34S). - Enter edit mode and digitize three point somewhere among the other points.
- Alternatively, use the same random point generation method as before, but specify only three points.
- Save your new layer as
distance_points.shp.
To generate a distance matrix using these points:
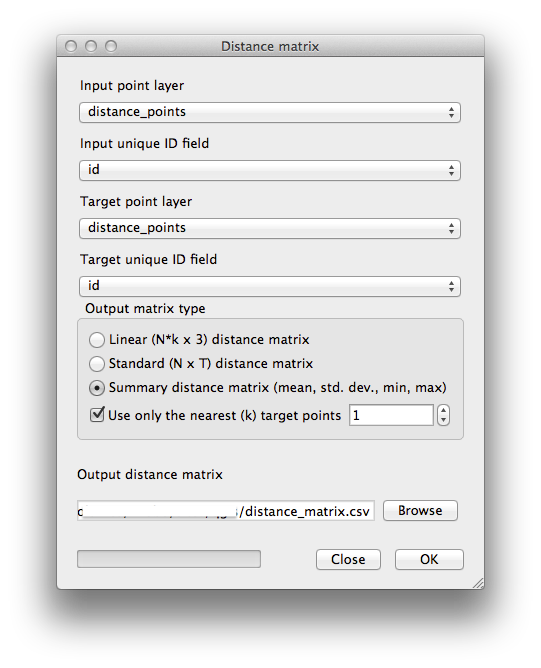
- Open the tool Vector ‣ Analysis Tools ‣ Distance matrix.
- Select the distance_points layer as the input layer, and the random_samples layer as the target layer.
Stel het als volgt in:

- Save the result as
distance_matrix.csv. - Click OK to generate the distance matrix.
- Open it in a spreadsheet program to see the results. Here is an example:

7.4.4.  Follow Along: Nearest Neighbor Analysis
To do a nearest neighbor analysis:
- Click on the menu item Vector ‣ Analysis Tools ‣ Nearest neighbor analysis.
- In the dialog that appears, select the random_samples layer and click OK.
- The results will appear in the dialog’s text window, for example:

Notitie
You can copy and paste the results into a spreadsheet. The data uses
a (colon :) separator.
7.4.5.  Follow Along: Gemiddelde coördinaten
De gemiddelde coördinaten van een gegevensset verkrijgen:
- Click on the Vector ‣ Analysis Tools ‣ Mean coordinate(s) menu item.
- In the dialog that appears, specify random_samples as the input layer, but leave the optional choices unchanged.
- Specify the output layer as
mean_coords.shp. - Click OK.
- Add the layer to the Layers list when prompted.
Laten we dit eens vergelijken met de centrale coördinaat van de polygoon die werd gebruikt om het willekeurige monster te maken.
- Click on the Vector ‣ Geometry Tools ‣ Polygon centroids menu item.
- In the dialog that appears, select roads_hull as the input layer.
- Save the result as
center_point. - Add it to the Layers list when prompted.
As you can see from the example below, the mean coordinates and the center of the study area (in orange) don’t necessarily coincide:

7.4.6.  Follow Along: Histogrammen van afbeeldingen
The histogram of a dataset shows the distribution of its values. The simplest way to demonstrate this in QGIS is via the image histogram, available in the Layer Properties dialog of any image layer.
- In your Layers list, right-click on the SRTM DEM layer.
Selecteer Eigenschappen.
Kies de tab Histogram. U moet misschien op de knop Histogram herberekenen klikken om de grafiek te genereren. U zult een grafiek zien die de frequentie van de waarden in de afbeelding beschrijft.
U kunt dat als een afbeelding exporteren:

- Select the Metadata tab, you can see more detailed information inside the Properties box.
The mean value is 332.8, and the maximum value is 1699! But those
values don’t show up on the histogram. Why not? It’s because there are so few
of them, compared to the abundance of pixels with values below the mean. That’s
also why the histogram extends so far to the right, even though there is no
visible red line marking the frequency of values higher than about 250.
Onthoud daarom dat een histogram u de verdeling van de waarden laat zien en dat niet alle waarden noodzakelijkerwijze ook zichtbaar zijn in de grafiek.
- (You may now close Layer Properties.)
7.4.7.  Follow Along: Ruimtelijke interpolatie
Let’s say you have a collection of sample points from which you would like to extrapolate data. For example, you might have access to the random_samples dataset we created earlier, and would like to have some idea of what the terrain looks like.
To start, launch the Grid (Interpolation) tool by clicking on the Raster ‣ Analysis ‣ Grid (Interpolation) menu item.
- In the Input file field, select
random_samples. - Check the Z Field box, and select the field
srtm_41_19. - Set the Output file location to
exercise_data/spatial_statistics/interpolation.tif. - Check the Algorithm box and select Inverse distance to a power.
- Set the Power to
5.0and the Smoothing to2.0. Leave the other values as-is. - Check the Load into canvas when finished box and click OK.
- When it’s done, click OK on the dialog that says
Process completed, click OK on the dialog showing feedback information (if it has appeared), and click Close on the Grid (Interpolation) dialog.
Hier is een vergelijking van de originele gegevensset (links) met die welke we hebben gemaakt uit onze monsterpunten (rechts). Die van u kan er anders uitzien vanwege de willekeurige herkomst van de locatie van de monsterpunten.

As you can see, 100 sample points aren’t really enough to get a detailed impression of the terrain. It gives a very general idea, but it can be misleading as well. For example, in the image above, it is not clear that there is a high, unbroken mountain running from east to west; rather, the image seems to show a valley, with high peaks to the west. Just using visual inspection, we can see that the sample dataset is not representative of the terrain.
7.4.8.  Try Yourself
- Use the processes shown above to create a new set of
1000random points. Gebruik die punten om een monster te nemen uit de originele DEM.
- Use the Grid (Interpolation) tool on this new dataset as above.
- Set the output filename to
interpolation_1000.tif, with Power and Smoothing set to5.0and2.0, respectively.
De resultaten (afhankelijk van de positie van uw willekeurige punten) zal er min of meer zo uitzien:

The border shows the roads_hull layer (which represents the boundary of the random sample points) to explain the sudden lack of detail beyond its edges. This is a much better representation of the terrain, due to the much greater density of sample points.
Here is an example of what it looks like with 10 000 sample points:

Notitie
It’s not recommended that you try doing this with 10 000 sample points if you are not working on a fast computer, as the size of the sample dataset requires a lot of processing time.
7.4.9.  Follow Along: Additional Spatial Analysis Tools
Originally a separate project and then accessible as a plugin, the SEXTANTE software has been added to QGIS as a core function from version 2.0. You can find it as a new QGIS menu with its new name Processing from where you can access a rich toolbox of spatial analysis tools allows you to access various plugin tools from within a single interface.
- Activate this set of tools by enabling the Processing ‣ Toolbox menu entry. The toolbox looks like this:

You will probably see it docked in QGIS to the right of the map. Note that the tools listed here are links to the actual tools. Some of them are SEXTANTE’s own algorithms and others are links to tools that are accessed from external applications such as GRASS, SAGA or the Orfeo Toolbox. This external applications are installed with QGIS so you are already able to make use of them. In case you need to change the configuration of the Processing tools or, for example, you need to update to a new version of one of the external applications, you can access its setting from Processing ‣ Options and configurations.
7.4.10.  Follow Along: Spatial Point Pattern Analysis
For a simple indication of the spatial distribution of points in the random_samples dataset, we can make use of SAGA’s Spatial Point Pattern Analysis tool via the Processing Toolbox you just opened.
- In the Processing Toolbox, search for this tool Spatial Point Pattern Analysis.
- Double-click on it to open its dialog.
7.4.10.1. Installing SAGA
Notitie
If SAGA is not installed on your system, the plugin’s dialog will inform you that the dependency is missing. If this is not the case, you can skip these steps.
7.4.10.2. On Windows
Included in your course materials you will find the SAGA installer for Windows.
- Start the program and follow its instructions to install SAGA on your Windows system. Take note of the path you are installing it under!
Once you have installed SAGA, you’ll need to configure SEXTANTE to find the path it was installed under.
- Click on the menu entry Analysis ‣ SAGA options and configuration.
- In the dialog that appears, expand the SAGA item and look for SAGA folder. Its value will be blank.
- In this space, insert the path where you installed SAGA.
7.4.10.3. On Ubuntu
- Search for SAGA GIS in the Software Center, or enter
the phrase
sudo apt-get install saga-gisin your terminal. (You may first need to add a SAGA repository to your sources.) - QGIS will find SAGA automatically, although you may need to restart QGIS if it doesn’t work straight away.
7.4.10.4. On Mac
Homebrew users can install SAGA with this command:
- brew install saga-core
If you do not use Homebrew, please follow the instructions here:
http://sourceforge.net/apps/trac/saga-gis/wiki/Compiling%20SAGA%20on%20Mac%20OS%20X
7.4.10.5. After installing
Now that you have installed and configured SAGA, its functions will become accessible to you.
7.4.10.6. Using SAGA
- Open the SAGA dialog.
- SAGA produces three outputs, and so will require three output paths.
- Save these three outputs under
exercise_data/spatial_statistics/, using whatever file names you find appropriate.

The output will look like this (the symbology was changed for this example):

The red dot is the mean center; the large circle is the standard distance, which gives an indication of how closely the points are distributed around the mean center; and the rectangle is the bounding box, describing the smallest possible rectangle which will still enclose all the points.
7.4.11.  Follow Along: Minimum Distance Analysis
Often, the output of an algorithm will not be a shapefile, but rather a table summarizing the statistical properties of a dataset. One of these is the Minimum Distance Analysis tool.
- Find this tool in the Processing Toolbox as Minimum Distance Analysis.
It does not require any other input besides specifying the vector point dataset to be analyzed.
- Choose the random_points dataset.
- Click OK. On completion, a DBF table will appear in the Layers list.
- Select it, then open its attribute table. Although the figures may vary, your results will be in this format:

7.4.12. In Conclusion
QGIS heeft vele mogelijkheden voor het analyseren van de ruimtelijke statistische eigenschappen van gegevenssets.
7.4.13. What’s Next?
Nu we vectoranalyse hebben behandeld, waarom niet eens kijken wat er met rasters gedaan kan worden? Dat is wat we zullen gaan doen in de volgende module!