Системы координат
 |
Цель: |
Ознакомиться с системами координат. |
Основные понятия: |
Система координат (CRS), проекция карты, перепроецирование «на лету», широта, долгота |
Обзор
Проекция карты это попытка отобразить поверхности Земли или её часть на плоском листе бумаги или экране компьютера. Система координат через координаты определяет как двумерные спроецированные карты в ГИС связаны с участками земной поверхности. Решение об использовании той или иной проекции и системы координат зависит от охвата области, с которой необходимо работать, типа анализа, который необходимо выполнить, и, очень часто, от наличия данных.
Подробнее о проекциях
Традиционным способом отображения формы Земли являются глобусы. Однако использование этого подхода имеет свои недостатки. Хотя глобусы по большому счету сохраняют форму Земли и иллюстрируют пространственную конфигурацию объектов размером с континент, их весьма проблематично носить в кармане. Кроме того, они удобны в использовании исключительно при малых масштабах (например 1:100 миллионам).
Большинство тематических карт, используемых в ГИС-приложениях, имеют гораздо больший масштаб. Обычно, наборы ГИС-данных имеют масштаб 1:250 000 или больше, в зависимости от уровня детализации. Глобус таких размеров будет дорогим и его использование будет очень сложным. Поэтому картографы разработали набор приемов, называемых проекциями карты, предназначенный для отображения сферической поверности Земли в двумерном пространстве с достаточной точностью.
Если рассматривать Землю вблизи, её можно считать плоской. Однако, при взгляде из космоса видно, что её форма приближена к сферической. Карты, как будет показано в следующем разделе, отражают реальность. На них показаны не только объекты, но и их форма и пространственное расположение. Каждая проекция имеет достоинства и недостатки. Выбор наилучшей проекции для карты определяется её масштабом и назначением. Например, проекция может давать неприемлемые искажения в случае отображения всего африканского континента, но идеально подходить для создания крупномасштабной (подробной) карты страны. Свойства проекций также могут влиять на визуальные параметры карты. Так, некоторые проекции хорошо подходят для маленьких областей, другие хороши для отображения объектов, протяженных с запада на восток, третьи — для объектов вытянутых с севера на юг.
Семейтва проекций
Процесс создания проекций можно представить так: внутри прозрачного глобуса с непрозрачными объектами на нём находится источник света. Тень объектов отбрасывается на плоский лист бумаги. Разные способы проецирования могут быть получены путем оборачивания глобуса листов в цилиндр, конус или просто прикладыванием листа. Каждый из этих методов образует семейство картографических проекций. Таким образом, существуют планарные (плоскостные), цилиндрические и конические проекции (см. рисунок figure_projection_families).
Figure Projection Families 1:
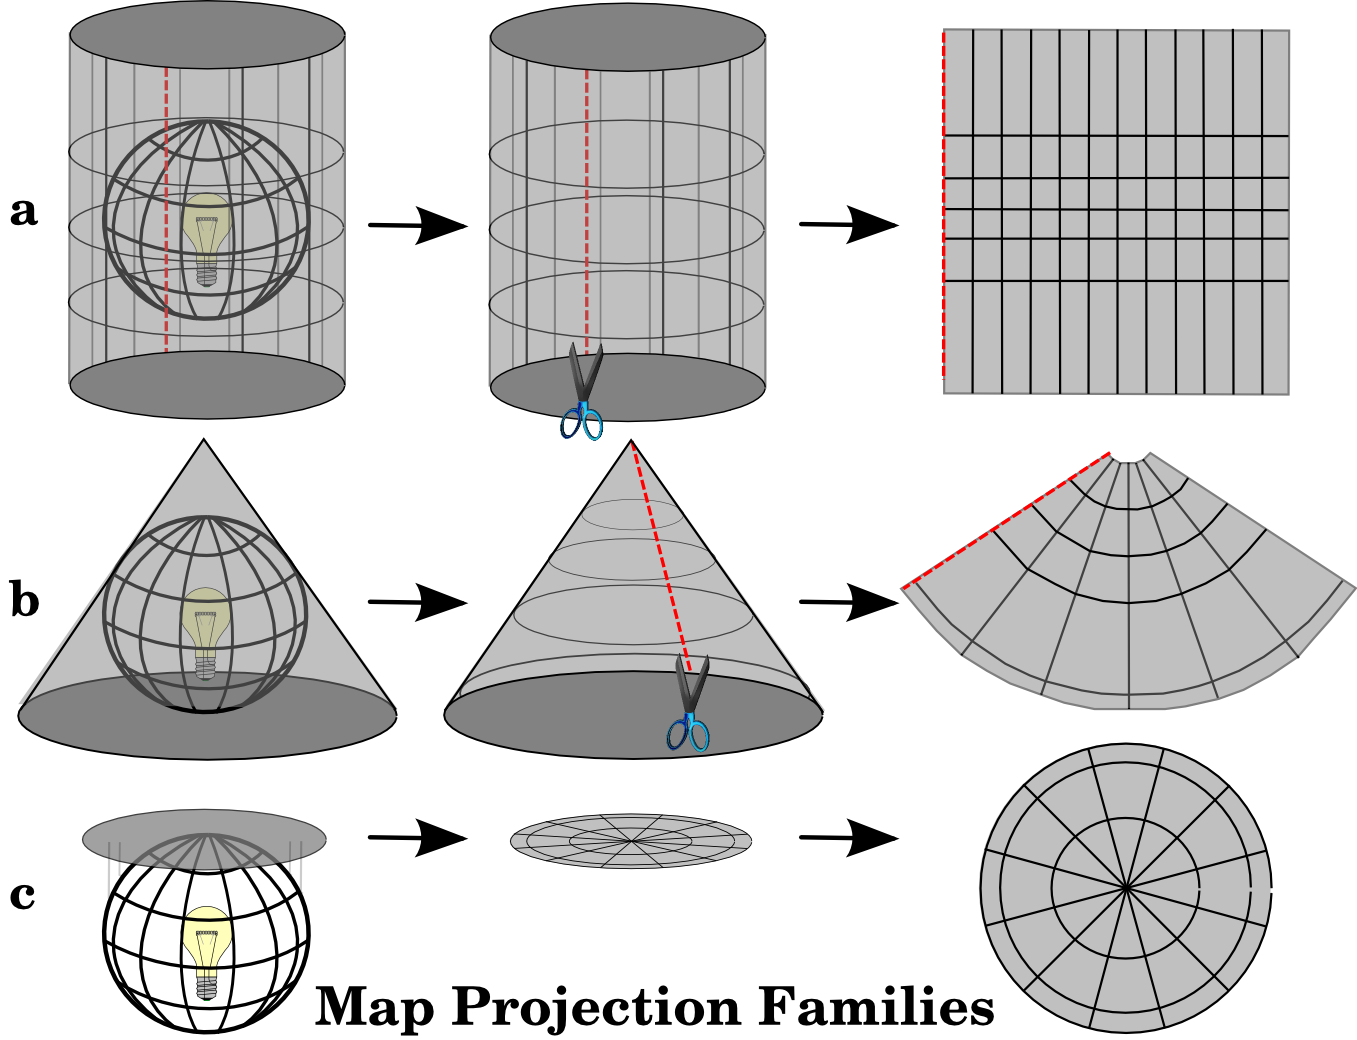
Три семейства картографических проекций. Слева направо a) цилиндрические, b) конические, c) планарные.
В настоящее время процесс проецирования сферической Земли на бумагу выполняется с использованием математических преобразований и тригонометрии. Но в основе лежит все то же пропускание луча света через глобус.
Точность проекций
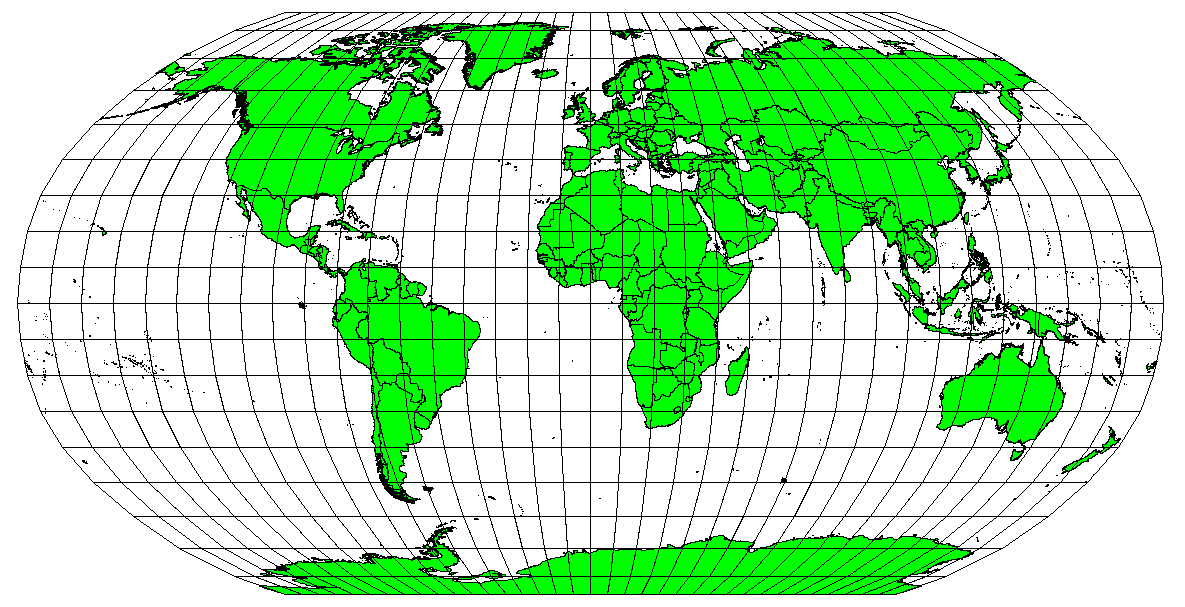
Картографические проекции никогда не дают абсолютно точное отображение сферической поверхности. В результате проецирования, карта получает искажения углов, площадей и расстояний. Проекции могут давать как несколько типов искажений, так и достаточно приемлемый результат, в котором искажения углов, площадей и расстояний находятся в допустимых приделах. Примером таких компромисных проекций могут служить тройная проекция Винкеля и проекция Робинсона, часто используемые для карт мира (см. рисунок figure_robinson_projection).
Figure Robinson Projection 1:
В большинстве случаев сохранить все характеристики исходных объектов при проецировании невозможно. Это значит, что когда вам требуется выполнить анализ, необходимо подбирать такую проекцию, которая даст наилучшие характеристики для анализа. Например, если требуется измерить расстояния, необходимо выбрать проекцию, которая обеспечит точные расстояния.
Равноугольные проекции
Когда мы работаем с глобусом, основные направления компаса (север, восток, юг и запад) всегда расположены под углом в 90 градусов друг к другу. Другими словами восток всегда будет находиться на 90 градусов от севера. Проекция может сохранять угловые направления, и такая проекция называется конморфной или равноугольной.
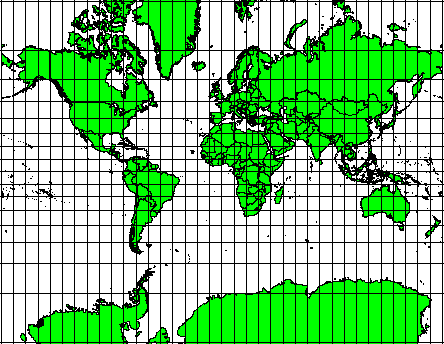
Проекции сохраняющие угловые величины очень важны. Они широко используются для навигационных и метеорологических задач. Необходимо помнить, что сохранять правильные углы на карте большой площади трудно, поэтому применять такие проекции лучше к небольшим участкам поверхности. Конморфные проекции искажают площади, а значит измерения площадей, выполненные в такой проекции будут неправильными. Чем больше площадь, тем менее точными будут измерения. Примерами проекций могут служить проекция Меркатора (см. рисунок figure_mercator_projection) и равноугольная коническая проекция Ламберта. Геоологическая служба США использует конморфные проекции для многих своих топографических карт.
Figure Mercator Projection 1:
Равнопромежуточные проекции
Если необходимо получить точные расстояния, то для карты выбирается проекция, хорошо передающая расстояния. Такие проекции, их называют равнопромежуточными, требуют, чтобы масштаб карты был неизменным. Карта будет равновеликой, когда она правильно передает расстояние от центра проекции до любой точки. Равнопромежуточные проекции обеспечивают точные расстояни от центра проекции или заданой линии. Такие проекции используются для сейсмических карт, а также для навигации. Хорошим примером равнопромежуточных проекций могут быть равнопромежуточная цилиндрическая Плате-Карре (см. рисунок figure_plate_caree_projection) и цилиндрическая равнопромежуточная. На эмблеме ООН испльзуется азимутальная равнопромежуточная проекция (см. рисунок figure_azimuthal_equidistant_projection).
Figure Plate Carree Projection 1:
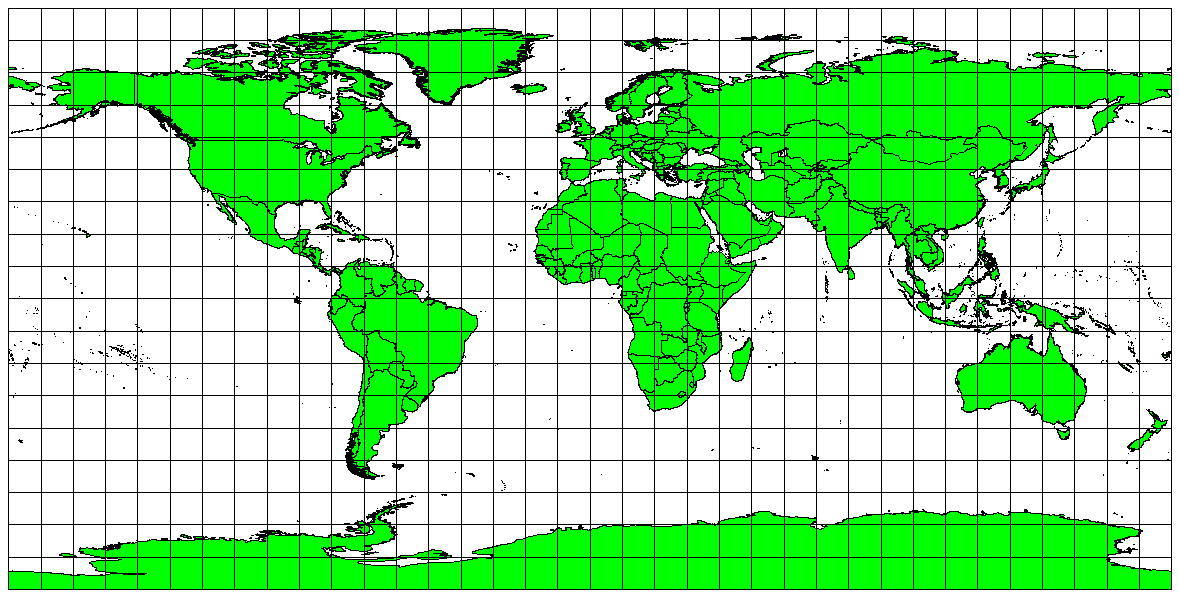
Равнопромежуточная цилиндрическая проекция Плате-Карре используется, когда необходимо получить точные расстояния.
Figure Azimuthal Equidistant Projection 1:
Равноплощадные проекции
When a map portrays areas over the entire map, so that all mapped areas have the same proportional relationship to the areas on the Earth that they represent, the map is an equal area map. In practice, general reference and educational maps most often require the use of equal area projections. As the name implies, these maps are best used when calculations of area are the dominant calculations you will perform. If, for example, you are trying to analyse a particular area in your town to find out whether it is large enough for a new shopping mall, equal area projections are the best choice. On the one hand, the larger the area you are analysing, the more precise your area measures will be, if you use an equal area projection rather than another type. On the other hand, an equal area projection results in** distortions of angular conformity** when dealing with large areas. Small areas will be far less prone to having their angles distorted when you use an equal area projection. Alber’s equal area, Lambert’s equal area and Mollweide Equal Area Cylindrical projections (shown in figure_mollweide_equal_area_projection) are types of equal area projections that are often encountered in GIS work.
Figure Mollweide Equal Area Projection 1:
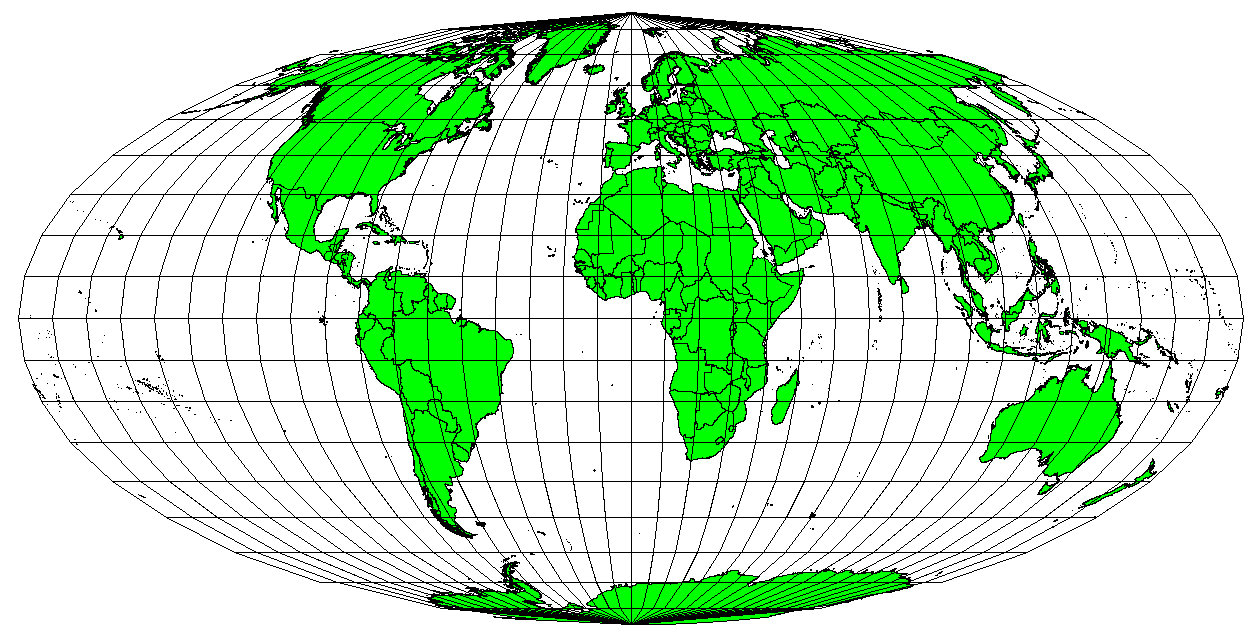
The Mollweide Equal Area Cylindrical projection, for example, ensures that all mapped areas have the same proportional relationship to the areas on the Earth.
Keep in mind that map projection is a very complex topic. There are hundreds of different projections available world wide each trying to portray a certain portion of the earth’s surface as faithfully as possible on a flat piece of paper. In reality, the choice of which projection to use, will often be made for you. Most countries have commonly used projections and when data is exchanged people will follow the national trend.
Подробнее о системах координат
With the help of coordinate reference systems (CRS) every place on the earth can be specified by a set of three numbers, called coordinates. In general CRS can be divided into projected coordinate reference systems (also called Cartesian or rectangular coordinate reference systems) and geographic coordinate reference systems.
Географические системы координат
The use of Geographic Coordinate Reference Systems is very common. They use degrees of latitude and longitude and sometimes also a height value to describe a location on the earth’s surface. The most popular is called WGS 84.
Lines of latitude run parallel to the equator and divide the earth into 180 equally spaced sections from North to South (or South to North). The reference line for latitude is the equator and each hemisphere is divided into ninety sections, each representing one degree of latitude. In the northern hemisphere, degrees of latitude are measured from zero at the equator to ninety at the north pole. In the southern hemisphere, degrees of latitude are measured from zero at the equator to ninety degrees at the south pole. To simplify the digitisation of maps, degrees of latitude in the southern hemisphere are often assigned negative values (0 to -90°). Wherever you are on the earth’s surface, the distance between the lines of latitude is the same (60 nautical miles). See figure_geographic_crs for a pictorial view.
Figure Geographic CRS 1:
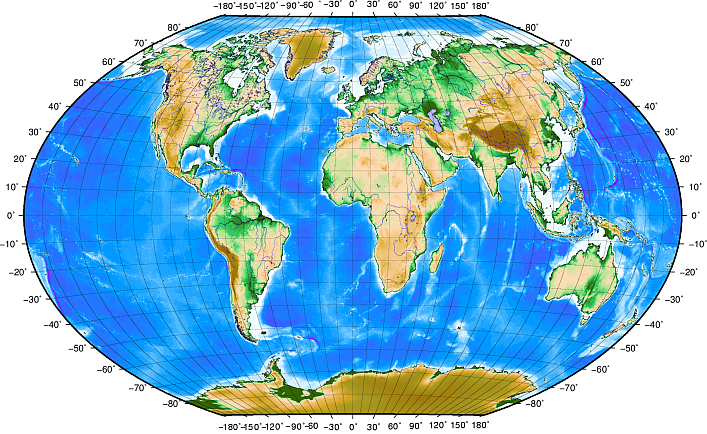
Geographic coordinate system with lines of latitude parallel to the equator and lines of longitude with the prime meridian through Greenwich.
Lines of longitude, on the other hand, do not stand up so well to the standard of uniformity. Lines of longitude run perpendicular to the equator and converge at the poles. The reference line for longitude (the prime meridian) runs from the North pole to the South pole through Greenwich, England. Subsequent lines of longitude are measured from zero to 180 degrees East or West of the prime meridian. Note that values West of the prime meridian are assigned negative values for use in digital mapping applications. See figure_geographic_crs for a pictorial view.
At the equator, and only at the equator, the distance represented by one line of longitude is equal to the distance represented by one degree of latitude. As you move towards the poles, the distance between lines of longitude becomes progressively less, until, at the exact location of the pole, all 360° of longitude are represented by a single point that you could put your finger on (you probably would want to wear gloves though). Using the geographic coordinate system, we have a grid of lines dividing the earth into squares that cover approximately 12363.365 square kilometres at the equator — a good start, but not very useful for determining the location of anything within that square.
To be truly useful, a map grid must be divided into small enough sections so that
they can be used to describe (with an acceptable level of accuracy) the location
of a point on the map. To accomplish this, degrees are divided into minutes
(') and seconds ("). There are sixty minutes in a degree, and sixty
seconds in a minute (3600 seconds in a degree). So, at the equator, one second
of latitude or longitude = 30.87624 meters.
Спроецированные системы координат
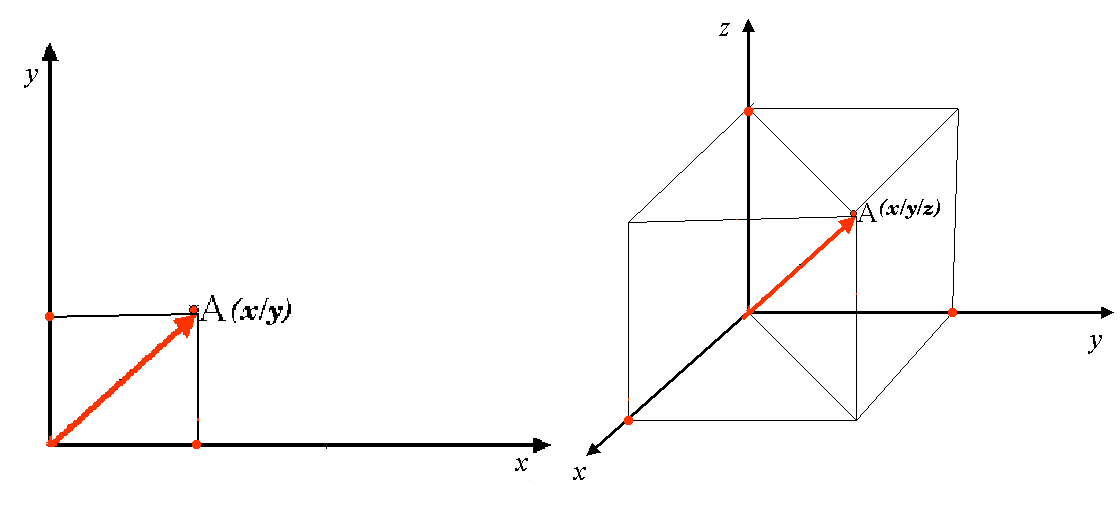
A two-dimensional coordinate reference system is commonly defined by two axes. At right angles to each other, they form a so called XY-plane (see figure_projected_crs on the left side). The horizontal axis is normally labelled X, and the vertical axis is normally labelled Y. In a three-dimensional coordinate reference system, another axis, normally labelled Z, is added. It is also at right angles to the X and Y axes. The Z axis provides the third dimension of space (see figure_projected_crs on the right side). Every point that is expressed in spherical coordinates can be expressed as an X Y Z coordinate.
Figure Projected CRS 1:
A projected coordinate reference system in the southern hemisphere (south of the equator) normally has its origin on the equator at a specific Longitude. This means that the Y-values increase southwards and the X-values increase to the West. In the northern hemisphere (north of the equator) the origin is also the equator at a specific Longitude. However, now the Y-values increase northwards and the X-values increase to the East. In the following section, we describe a projected coordinate reference system, called Universal Transverse Mercator (UTM) often used for South Africa.
Универсальная поперечная проекция Меркатора (UTM)
The Universal Transverse Mercator (UTM) coordinate reference system has its origin on the equator at a specific Longitude. Now the Y-values increase southwards and the X-values increase to the West. The UTM CRS is a global map projection. This means, it is generally used all over the world. But as already described in the section ‘accuracy of map projections’ above, the larger the area (for example South Africa) the more distortion of angular conformity, distance and area occur. To avoid too much distortion, the world is divided into 60 equal zones that are all 6 degrees wide in longitude from East to West. The UTM zones are numbered 1 to 60, starting at the international date line (zone 1 at 180 degrees West longitude) and progressing East back to the international date line (zone 60 at 180 degrees East longitude) as shown in figure_utm_zones.
Figure UTM Zones 1:
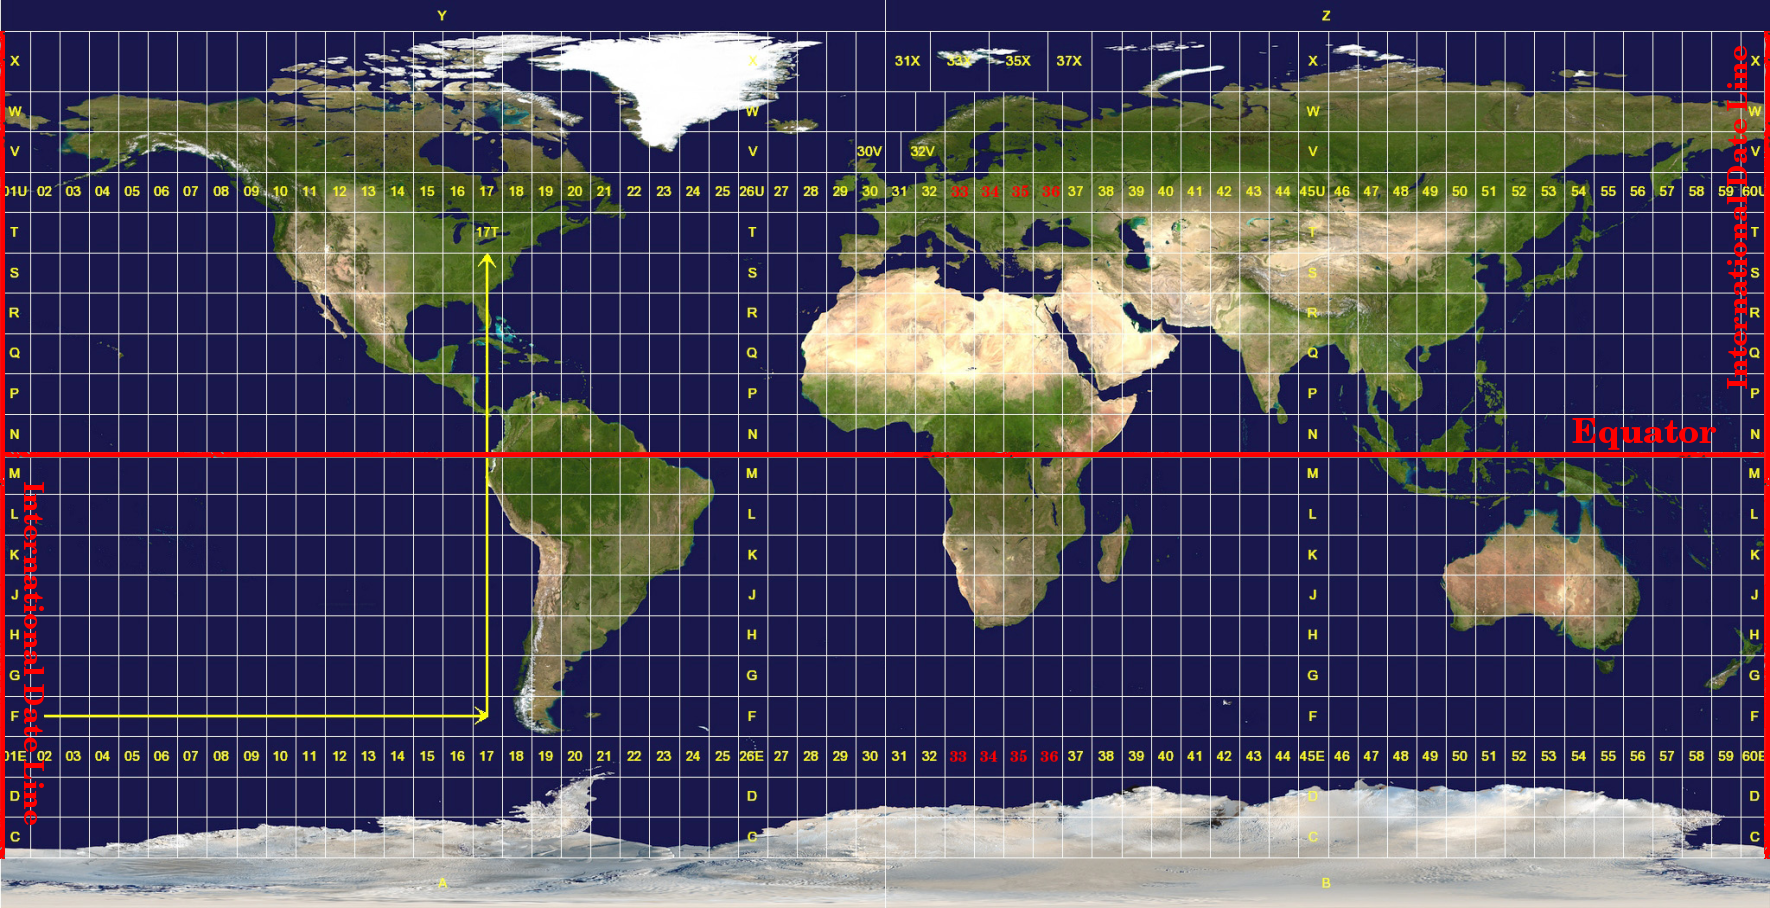
The Universal Transverse Mercator zones. For South Africa UTM zones 33S, 34S, 35S, and 36S are used.
As you can see in figure_utm_zones and figure_utm_for_sa, South Africa is covered by four UTM zones to minimize distortion. The zones are called UTM 33S, UTM 34S, UTM 35S and UTM 36S. The S after the zone means that the UTM zones are located south of the equator.
Figure UTM for South Africa 1:
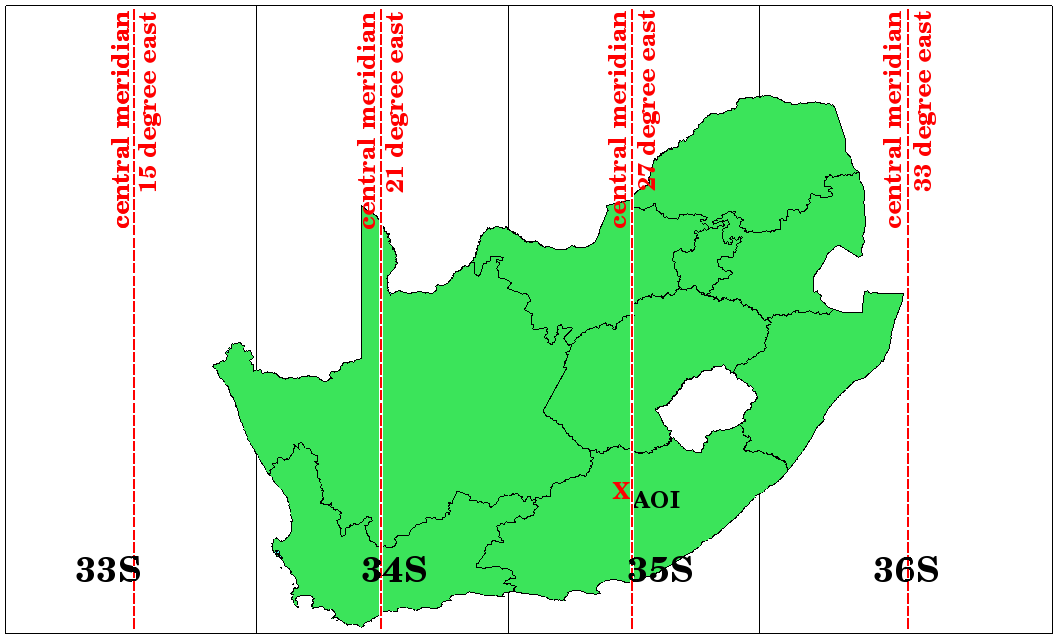
UTM zones 33S, 34S, 35S, and 36S with their central longitudes (meridians) used to project South Africa with high accuracy. The red cross shows an Area of Interest (AOI).
Say, for example, that we want to define a two-dimensional coordinate within the Area of Interest (AOI) marked with a red cross in figure_utm_for_sa. You can see, that the area is located within the UTM zone 35S. This means, to minimize distortion and to get accurate analysis results, we should use UTM zone 35S as the coordinate reference system.
The position of a coordinate in UTM south of the equator must be indicated with the zone number (35) and with its northing (y) value and easting (x) value in meters. The northing value is the distance of the position from the equator in meters. The easting value is the distance from the central meridian (longitude) of the used UTM zone. For UTM zone 35S it is 27 degrees East as shown in figure_utm_for_sa. Furthermore, because we are south of the equator and negative values are not allowed in the UTM coordinate reference system, we have to add a so called false northing value of 10,000,000 m to the northing (y) value and a false easting value of 500,000 m to the easting (x) value. This sounds difficult, so, we will do an example that shows you how to find the correct UTM 35S coordinate for the Area of Interest.
The northing (y) value
The place we are looking for is 3,550,000 meters south of the equator, so the northing (y) value gets a negative sign and is -3,550,000 m. According to the UTM definitions we have to add a false northing value of 10,000,000 m. This means the northing (y) value of our coordinate is 6,450,000 m (-3,550,000 m + 10,000,000 m).
The easting (x) value
First we have to find the central meridian (longitude) for the UTM zone 35S. As we can see in figure_utm_for_sa it is 27 degrees East. The place we are looking for is 85,000 meters West from the central meridian. Just like the northing value, the easting (x) value gets a negative sign, giving a result of -85,000 m. According to the UTM definitions we have to add a false easting value of 500,000 m. This means the easting (x) value of our coordinate is 415,000 m (-85,000 m + 500,000 m). Finally, we have to add the zone number to the easting value to get the correct value.
As a result, the coordinate for our Point of Interest, projected in UTM zone 35S would be written as: 35 415,000 m E / 6,450,000 m N. In some GIS, when the correct UTM zone 35S is defined and the units are set to meters within the system, the coordinate could also simply appear as 415,000 6,450,000.
Перепроецирование «на лету»
As you can probably imagine, there might be a situation where the data you want to use in a GIS are projected in different coordinate reference systems. For example, you might get a vector layer showing the boundaries of South Africa projected in UTM 35S and another vector layer with point information about rainfall provided in the geographic coordinate system WGS 84. In GIS these two vector layers are placed in totally different areas of the map window, because they have different projections.
To solve this problem, many GIS include a functionality called оn-the-fly projection. It means, that you can define a certain projection when you start the GIS and all layers that you then load, no matter what coordinate reference system they have, will be automatically displayed in the projection you defined. This functionality allows you to overlay layers within the map window of your GIS, even though they may be in different reference systems.
Частые ошибки / о чем стоит помнить
The topic map projection is very complex and even professionals who have studied geography, geodetics or any other GIS related science, often have problems with the correct definition of map projections and coordinate reference systems. Usually when you work with GIS, you already have projected data to start with. In most cases these data will be projected in a certain CRS, so you don’t have to create a new CRS or even re project the data from one CRS to another. That said, it is always useful to have an idea about what map projection and CRS means.
Что мы узнали?
Подведём итоги:
- Map projections portray the surface of the earth on a two-dimensional, flat piece of paper or computer screen.
- There are global map projections, but most map projections are created and optimized to project smaller areas of the earth’s surface.
- Map projections are never absolutely accurate representations of the spherical earth. They show distortions of angular conformity, distance and area. It is impossible to preserve all these characteristics at the same time in a map projection.
- A Coordinate reference system (CRS) defines, with the help of coordinates, how the two-dimensional, projected map is related to real locations on the earth.
- There are two different types of coordinate reference systems: Geographic Coordinate Systems and Projected Coordinate Systems.
- On the Fly projection is a functionality in GIS that allows us to overlay layers, even if they are projected in different coordinate reference systems.
Попробуйте сами!
Вот некоторые идеи для заданий:
- Start QGIS and load two layers of the same area but with different projections
and let your pupils find the coordinates of several places on the two layers.
You can show them that it is not possible to overlay the two layers. Then define
the coordinate reference system as Geographic/WGS 84 inside the
Project Properties dialog and activate the checkbox
 Enable on-the-fly CRS transformation. Load the two layers of the
same area again and let your pupils see how on-the-fly projection works.
 - You can open the Project Properties dialog in QGIS and show your pupils the many different Coordinate Reference Systems so they get an idea of the complexity of this topic. With ‘on-the-fly’ CRS transformation enabled you can select different CRS to display the same layer in different projections.
Стоит учесть
If you don’t have a computer available, you can show your pupils the principles of the three map projection families. Get a globe and paper and demonstrate how cylindrical, conical and planar projections work in general. With the help of a transparency sheet you can draw a two-dimensional coordinate reference system showing X axes and Y axes. Then, let your pupils define coordinates (x and y values) for different places.
Дополнительная литература
Книги:
- Chang, Kang-Tsung (2006). Introduction to Geographic Information Systems. 3rd Edition. McGraw Hill. ISBN: 0070658986
- DeMers, Michael N. (2005). Fundamentals of Geographic Information Systems. 3rd Edition. Wiley. ISBN: 9814126195
- Galati, Stephen R. (2006): Geographic Information Systems Demystified. Artech House Inc. ISBN: 158053533X
Веб-сайты:
- http://www.colorado.edu/geography/gcraft/notes/mapproj/mapproj_f.html
- http://geology.isu.edu/geostac/Field_Exercise/topomaps/index.htm
Работа с проекциями в QGIS подробно описана в Руководстве пользователя QGIS.
Что дальше?
Следующий раздел посвящен созданию карт.
