Prezentare GIS
 |
Obiective: |
Înțelegerea a ceea ce este GIS și la ce poate fi folosit. |
Cuvinte cheie: |
GIS, Computer, Hărți, Date, Sistem de Informații Spațiale, Analiză |
Prezentare generală
Așa cum folosim un procesor de text pentru a scrie documente, în același mod putem folosi o aplicație GIS pentru a organiza informațiile spațiale. GIS reprezintă un acronim pentru ‘Sistem de Informaţii Geografice’.
GIS este alcătuit din:
- Date digitale — informațiile geografice pe care le veți afișa și
le veți analiza folosind calculatoare și programe.
Echipamente de calcul — computere utilizate la stocarea, afișarea și procesarea datelor.
Programe de calculator — soft-uri care rulează pe echipamente de calcul și care vă permit să lucrați cu datele digitale. Un program de calculator care face parte din GIS se numește Aplicație GIS.
Cu o aplicație GIS se pot deschide hărți digitale de pe computer, se pot adăuga noi informații spațiale hărților existente, se pot tipări hărți personalizate și se poate efectua analiza spațială.
Let’s look at a little example of how GIS can be useful. Imagine you are a health worker and you make a note of the date and place of residence of every patient you treat.
Longitudine |
Latitudine |
Boală |
Dată |
|---|---|---|---|
| 26.870436 | -31.909519 | Oreion |
13/12/2008 |
| 26.868682 | -31.909259 | Oreion |
24/12/2008 |
| 26.867707 | -31.910494 | Oreion |
22/01/2009 |
| 26.854908 | -31.920759 | Pojar |
11/01/2009 |
| 26.855817 | -31.921929 | Pojar |
26/01/2009 |
| 26.852764 | -31.921929 | Pojar |
10/02/2009 |
| 26.854778 | -31.925112 | Pojar |
22/02/2009 |
| 26.869072 | -31.911988 | Oreion |
02/02/2009 |
| 26.863354 | -31.916406 | Varicelă |
26/02/2009 |
Dacă priviți tabelul de mai sus, veți observa rapid că au existat o mulțime de cazuri de rujeolă în ianuarie și februarie. Lucrătorul în sănătate a înregistrat locația casei fiecărui pacient, notând latitudinea și longitudinea în tabel. Folosind aceste date într-o aplicație GIS, putem înțelege repede mult mai multe despre modelul îmbolnăvirii:
Figure Patterns of illness:
Mai multe despre GIS
GIS este un domeniu relativ nou — a început în anii 1970. Aplicațiile GIS computerizate erau disponibile doar pentru companii și universități care dețineau echipamente informatice scumpe. În zilele noastre, oricine dispune de un calculator personal sau un laptop poate folosi software-ul GIS. În plus, de-a lungul timpului, aplicațiile GIS au devenit mai ușor de utilizat — chiar dacă e necesară o instruire solidă pentru utilizarea unei aplicații GIS, acest domeniu este mult mai ușor de abordat, atât pentru amatori cât și pentru utilizatorii ocazionali. Așa cum s-a specificat mai sus, GIS înseamnă mult mai mult decât un program, incluzând și toate aspectele legate de gestionarea și utilizarea datelor geografice digitale. În următoarele tutoriale ne vom concentra pe soft-ul GIS.
Ce este un software GIS / o aplicație GIS?
You can see an example of what a GIS Application looks like figure_gis_application. GIS Applications are normally programs with a graphical user interface that can be manipulated using the mouse and keyboard. The application provides menus near to the top of the window (File, Edit etc.) which, when clicked using the mouse, show a panel of actions. These actions provide a way for you to tell the GIS Application what you want to do. For example you may use the menus to tell the GIS Application to add a new layer to the display output.
Figure Menus in GIS Application:
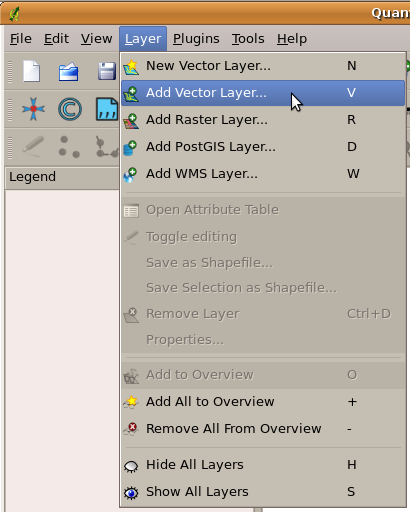
Application menus, when clicked with the mouse, expand to show a list of actions that can be carried out.
Toolbars (rows of small pictures that can be clicked with the mouse) normally sit just below the menus and provide a quicker way to use frequently needed actions.
Figure Toolbars in GIS Application:

Toolbars provide quick access to commonly used functions. Holding your mouse over a picture will usually tell you what will happen when you click on it.
A common function of GIS Applications is to display map layers. Map layers are stored as files on a disk or as records in a database. Normally each map layer will represent something in the real world –– a roads layer for example will have data about the street network.
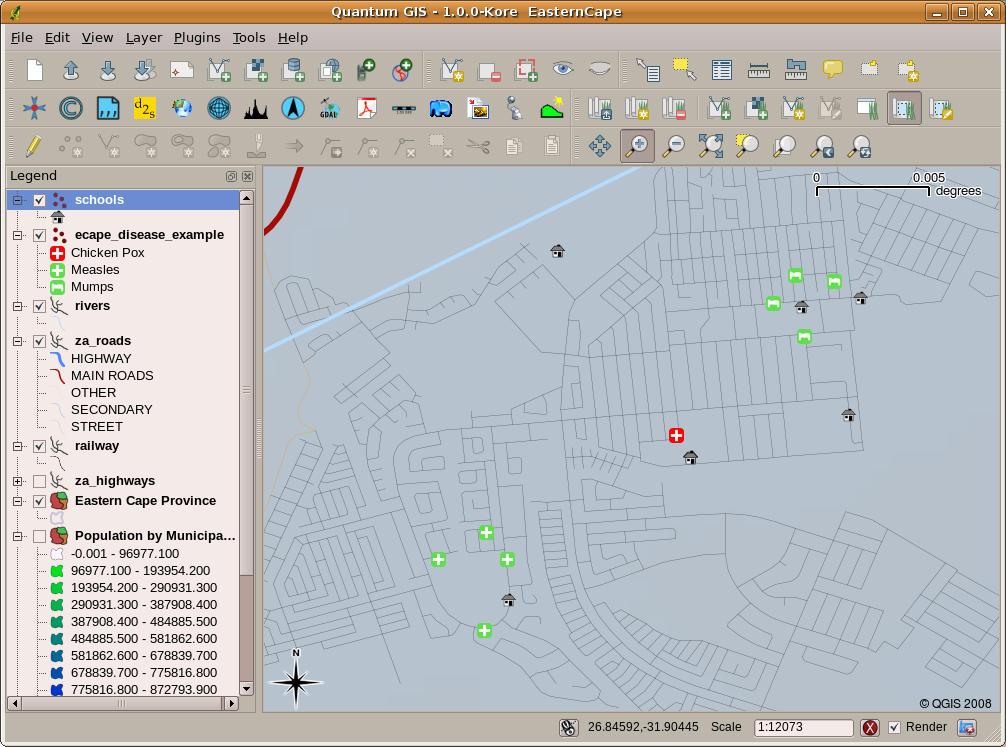
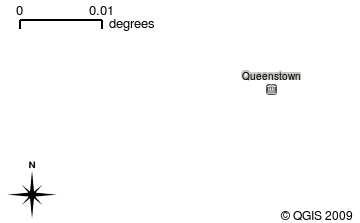
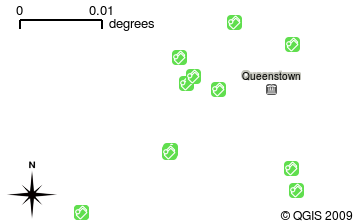
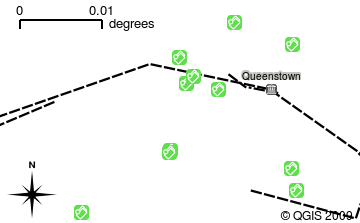
Când deschideți un strat în aplicația GIS, acesta va apărea într-o vedere a hărții. În acest caz, vederea hărții va consta într-o reprezentare grafică a stratului dvs. Când adăugați mai mult de un strat unei vederi, straturile vor fi suprapuse, în ordine. Uitați-vă la figurile vederea_1, vederea_2, vederea_3 și vederea_4 pentru a vedea o hartă, la care mai multe straturi sunt adăugate, pe rând. Vederea are funcții importante, cum ar fi cea care vă permite mărirea sau micșorarea suprafeței vizualizate, sau deplasarea (panning) în cadrul hărții.
Figure Map View 1:
Figure Map View 2:
Figure Map View 3:
Figure Map View 4:
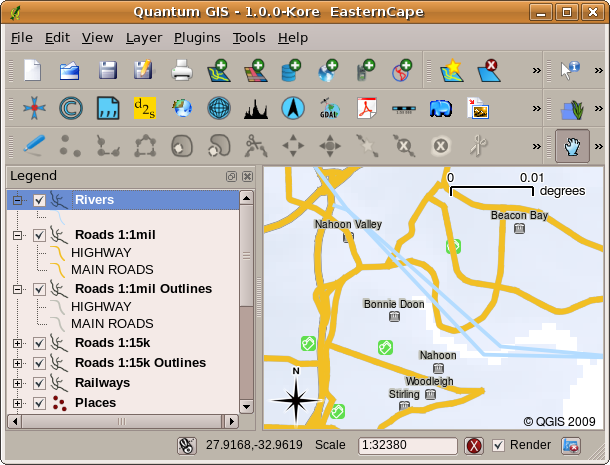
Another common feature of GIS Applications is the map legend. The map legend provides a list of layers that have been loaded in the GIS Application. Unlike a paper map legend, the map legend or ‘layers list’ in the GIS Application provides a way to re-order, hide, show and group layers. Changing the layer order is done by clicking on a layer in the legend, holding the mouse button down and then dragging the layer to a new position. In figures figure_map_legend_1 and figure_map_legend_2 the map legend is shown as the area to the left of the GIS Application window. By changing the layer order, the way that layers are drawn can be adjusted –– in this case so that rivers are drawn over the roads instead of below them.
Figure Map Symbology 1:
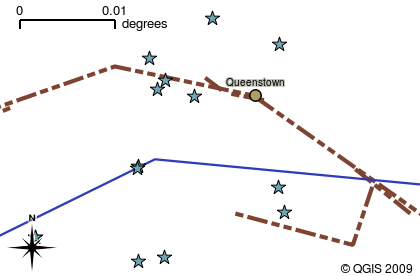
Software-ul GIS vă permite să modificați cu ușurință simbologia — modul în care este afișată informația.
Figure Map Legend 1:
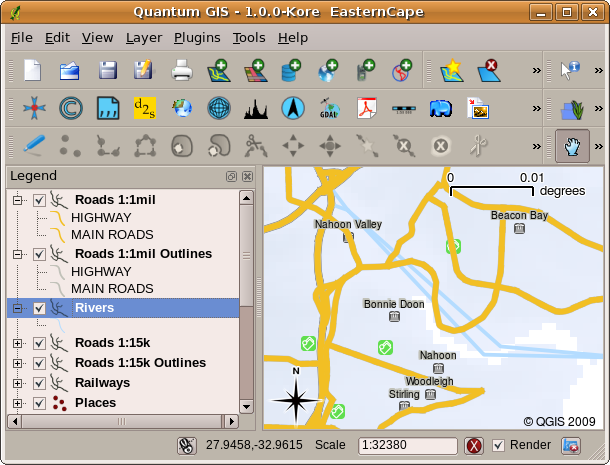
Changing the layer order allows to adjust the way that layers are drawn. Before changing the layer order, rivers are drawn underneath roads
Figure Map Legend 2:
Getting a GIS Application for your own computer(s)
There are many different GIS Applications available. Some have many sophisticated features and cost tens of thousands of Rands for each copy. In other cases, you can obtain a GIS Application for free. Deciding which GIS Application to use is a question of how much money you can afford and personal preference. For these tutorials, we will be using the QGIS Application. QGIS is completely free and you can copy it and share it with your friends as much as you like. If you received this tutorial in printed form, you should have received a copy of QGIS with it. If not, you can always visit http://hub.qgis.org/projects/quantum-gis/wiki/Download to download your free copy if you have access to the internet.
Datele GIS
Now that we know what a GIS is and what a GIS Application can do, let’s talk about GIS data. Data is another word for information. The information we use in a GIS normally has a geographical aspect to it. Think of our example above, about the health care worker. She created a table to record diseases that looked like this:
Longitudine |
Latitudine |
Boală |
Dată |
|---|---|---|---|
| 26.870436 | -31.909519 | Oreion |
13/12/2008 |
The longitude and latitude columns hold geographical data. The disease and date columns hold non-geographical data.
A common feature of GIS is that they allow you to associate information (non-geographical data) with places (geographical data). In fact, the GIS Application can store many pieces of information which are associated with each place –– something that paper maps are not very good at. For example, our health care worker could store the person’s age and gender on her table. When the GIS Application draws the layer, you can tell it to draw the layer based on gender, or based on disease type, and so on. So, with a GIS Application we have a way to easily change the appearance of the maps we created based on the non-geographical data associated with places.
GIS Systems work with many different types of data. Vector data is stored as
a series of X, Y coordinate pairs inside the computer’s memory. Vector data
is used to represent points, lines and areas. Illustration figure_vector_data
shows different types of vector data being viewed in a GIS application. In the
tutorials that follow we will be exploring vector data in more detail.
Figure Vector Data 1:
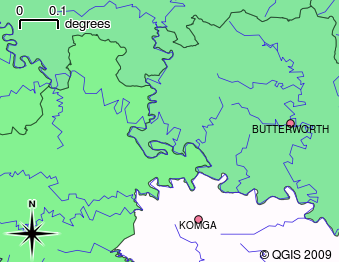
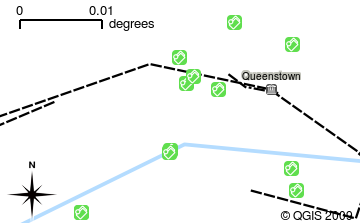
Vector data is used to represent points (e.g. towns), lines (e.g. rivers) and polygons (e.g. municipal boundaries).
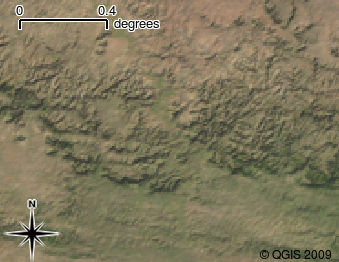
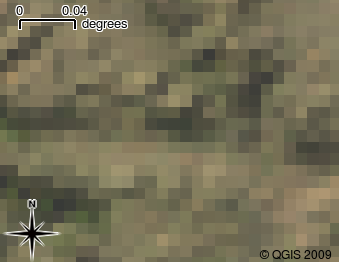
Raster data are stored as a grid of values. There are many satellites circling the earth and the photographs they take are a kind of raster data that can be viewed in a GIS. One important difference between raster and vector data is that if you zoom in too much on a raster image, it will start to appear ‘blocky’ (see illustrations figure_raster_data_1 and figure_raster_data_2). In fact these blocks are the individual cells of the data grid that makes up the raster image. We will be looking at raster data in greater detail in later tutorials.
Figure Raster Data 1:
Figure Raster Data 2:
What have we learned?
Let’s wrap up what we covered in this worksheet:
- A GIS is a system of computer hardware, computer software and geographical data.
- A GIS Application allows you to view geographical data and is an important part of the GIS.
- A GIS Application normally consists of a menu bar, toolbars, a map view and a legend.
- Vector and raster data are geographical data used in a GIS application.
- Geographical data can have associated non-geographical data.
Now you try!
Here are some ideas for you to try with your learners:
- Geography: Describe the concept of GIS to your learners as outlined in this
tutorial. Ask them to try to think of 3 reasons why it might be handy to use a
GIS instead of paper maps. Here are some that we could think of:
- GIS Applications allow you to create many different types of maps from the same data.
- GIS is a great visualisation tool that can show you things about your data and how they are related in space (e.g. those disease outbreaks we saw earlier).
- Paper maps need to be filed and are time consuming to view. The GIS can hold a very large amount of map data and make it quick and easy to find a place you are interested in.
- Geography: Can you and your learners think of how raster data from
satellites could be useful? Here are some ideas we had:
- During natural disasters, raster data can be useful to show where the impacted areas are. For example a recent satellite image taken during a flood can help to show where people may need rescuing.
- Sometimes people do bad things to the the environment, like dumping dangerous chemicals that kill plants and animals. Using raster data from satellites can help us to monitor for these type of problems.
- Town planners can use raster data from satellites to see where informal settlements are and to help in planning infrastructure.
Something to think about
If you don’t have a computer available, many of the topics we cover in this tutorial can be reproduced using an overhead and transparency as it uses the same technique of layering information. However, to properly understand GIS it is always better to learn it using a computer.
Further reading
Book: Desktop GIS: Mapping the Planet with Open Source Tools. Author: Gary Sherman. ISBN: 9781934356067
Website: http://www.gisdevelopment.net/tutorials/tuman006.htm
The QGIS User Guide also has more detailed information on working with QGIS.
What’s next?
In the sections that follow we are going to go into more detail, showing you how to use a GIS Application. All of the tutorials will be done using QGIS. Next up, let’s look at vectors!
