.
一般ツール
キーボードショートカット
QGIS provides default keyboard shortcuts for many features. You can find them in section メニューバー. Additionally, the menu option Settings ‣ Configure Shortcuts.. allows you to change the default keyboard shortcuts and to add new keyboard shortcuts to QGIS features.
Figure Shortcuts 1:
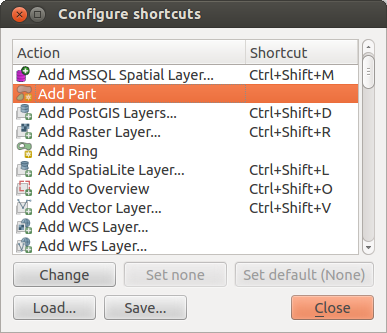
Define shortcut options  (Gnome)
Configuration is very simple. Just select a feature from the list and click on [Change], [Set none] or [Set default]. Once you have finished your configuration, you can save it as an XML file and load it to another QGIS installation.
コンテキストヘルプ
特定のトピックでヘルプが必要な場合多くのダイアログに実装されている [Help] ボタンでコンテキストヘルプを利用することができます- サードパーティプラグインでは専用のウェッブページを指し示すことを注意して下さい.
レンダリング
By default, QGIS renders all visible layers whenever the map canvas is refreshed. The events that trigger a refresh of the map canvas include:
レイヤの追加
パンまたはズーム
- Resizing the QGIS window
レイヤまたはレイヤ群の表示、非表示を変更します
QGIS allows you to control the rendering process in a number of ways.
スケール依存レンダリング
スケール依存レンダリングを利用するとあるレイヤが表示される最小と最大のスケールを指定することができます. スケール依存レンダリングを設定する場合レイヤを凡例でダブルクリックして プロパティ ダイアログを開いて下さい. 一般情報 タブで,  縮尺に応じた表示設定 チェックボックスをアクティブにして最小と最大の縮尺値を設定して下さい.
You can determine the scale values by first zooming to the level you want to use and noting the scale value in the QGIS status bar.
地図レンダリングの制御
Map rendering can be controlled in the various ways, as described below.
描画の中断
To suspend rendering, click the Render checkbox in the
lower right corner of the status bar. When the Render
checkbox is not checked, QGIS does not redraw the canvas in response to any of
the events described in section レンダリング. Examples of when you
might want to suspend rendering include:
沢山のレイヤを追加して描画する前に描画方法を編集したい場合
データ量が多いレイヤを追加して描画する前に縮尺依存描画条件を指定したい場合
データ量が多いレイヤを追加して描画する前に特定の位置にズームしておきたい場合
上記の場合のいくつかの組み合わせ
Checking the Render checkbox enables rendering and
causes an immediate refresh of the map canvas.
レイヤ追加オプションの設定
新しくレイヤを追加した時に,すぐに描画しないオプションを設定できます.これはレイヤが地図に追加された時に,地図凡例の可視属性チェックボックスがデフォルトでチェックされないことを意味します.このオプションを指定するためには 設定 ‣ オプション ‣ を選択して レンダリング タブをクリックしてください.
By default new layers added to the map should be displayed のチェックを解除してください.すると,地図に追加されたレイヤの表示属性は不可視の状態がデフォルトになります.
描画の中断
地図描画を中断したい場合は ESC キーを押して下さい.これにより地図キャンパスの更新が中断され地図の一部が描画された状態になります. ESC キーを押してから地図描画が中断されるまで少し時間がかかります.
ノート
現在描画中断機能は利用できません - これはQt4のポートに依存しています,なぜならばユーザーインターフェース(UI)に問題が発生してクラッシュするからです.
Updating the Map Display During Rendering
You can set an option to update the map display as features are drawn. By default, QGIS does not display any features for a layer until the entire layer has been rendered. To update the display as features are read from the datastore, choose menu option Settings ‣ Options and click on the Rendering tab. Set the feature count to an appropriate value to update the display during rendering. Setting a value of 0 disables update during drawing (this is the default). Setting a value too low will result in poor performance, as the map canvas is continually updated during the reading of the features. A suggested value to start with is 500.
描画品質への影響
To influence the rendering quality of the map, you have two options. Choose menu option Settings ‣ Options, click on the Rendering tab and select or deselect following checkboxes:
- Make lines appear less jagged at the expense of some
drawing performance
- Fix problems with incorrectly filled polygons
スピードアップレンダリング
There are two settings that allow you to improve rendering speed. Open the QGIS options dialog using Settings ‣ Options, go to the Rendering tab and select or deselect the following checkboxes:
- Enable back buffer. This provides better graphics
performance at the cost of losing the possibility to cancel rendering and
incrementally draw features. If it is unchecked, you can set the
Number of features to draw before updating the display, otherwise
this option is inactive.
- 再描画の速度を上げられる場合にレンダのキャッシュを利用します
計測
Measuring works within projected coordinate systems (e.g., UTM) and unprojected data. If the loaded map is defined with a geographic coordinate system (latitude/longitude), the results from line or area measurements will be incorrect. To fix this, you need to set an appropriate map coordinate system (see section 投影法の利用方法). All measuring modules also use the snapping settings from the digitizing module. This is useful, if you want to measure along lines or areas in vector layers.
To select a measuring tool, click on  and select the tool you want
to use.
and select the tool you want
to use.
Measure length, areas and angles
Measure Line: QGIS is able to measure real distances
between given points according to a defined ellipsoid. To configure this,
choose menu option Settings ‣ Options, click on the
Map tools tab and select the appropriate ellipsoid. There, you can
also define a rubberband color and your preferred measurement units (meters or
feet) and angle units (degrees, radians and gon). The tool then allows you to
click points on the map. Each segment length, as well as the total, shows up in
the measure window. To stop measuring, click your right mouse button.
Note that you can interactively change the measurement units in the measurement
dialog. It overrides the Preferred measurement units in the options.
There is an info section in the dialog that shows which CRS settings are being used
during measurement calculations.
Figure Measure 1:
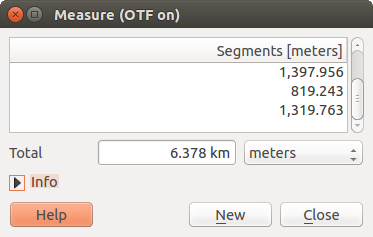
Measure Distance (Gnome)
 Measure Area: Areas can also be measured. In the
measure window, the accumulated area size appears. In addition, the measuring
tool will snap to the currently selected layer, provided that layer has its
snapping tolerance set (see section スナップ許容量と検索半径の設定). So, if you want
to measure exactly along a line feature, or around a polygon feature, first set
its snapping tolerance, then select the layer. Now, when using the measuring
tools, each mouse click (within the tolerance setting) will snap to that layer.
Measure Area: Areas can also be measured. In the
measure window, the accumulated area size appears. In addition, the measuring
tool will snap to the currently selected layer, provided that layer has its
snapping tolerance set (see section スナップ許容量と検索半径の設定). So, if you want
to measure exactly along a line feature, or around a polygon feature, first set
its snapping tolerance, then select the layer. Now, when using the measuring
tools, each mouse click (within the tolerance setting) will snap to that layer.
Figure Measure 2:
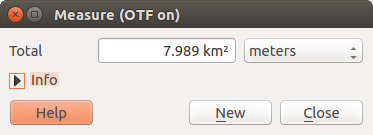
Measure Area (Gnome)
 Measure Angle: You can also measure angles. The
cursor becomes cross-shaped. Click to draw the first segment of the angle you
wish to measure, then move the cursor to draw the desired angle. The measure
is displayed in a pop-up dialog.
Measure Angle: You can also measure angles. The
cursor becomes cross-shaped. Click to draw the first segment of the angle you
wish to measure, then move the cursor to draw the desired angle. The measure
is displayed in a pop-up dialog.
Figure Measure 3:
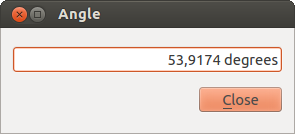
Measure Angle (Gnome)
地物の選択と選択解除
The QGIS toolbar provides several tools to select features in the map canvas.
To select one or several features, just click on  and select your
tool:
and select your
tool:
- Select Single Feature
 Select Features by Rectangle
 Select Features by Polygon
 Select Features by Freehand
 Select Features by Radius
To deselect all selected features click on  Deselect
features from all layers.
Deselect
features from all layers.
 Select feature using an expression allow user
to select feature using expression dialog. See Expressions
chapter for some example.
Select feature using an expression allow user
to select feature using expression dialog. See Expressions
chapter for some example.
Users can save features selection into a New Memory Vector Layer or a New Vector Layer using Edit ‣ Paste Feature as ... and choose the mode you want.
地物情報表示
The Identify tool allows you to interact with the map canvas and get information on features
in a pop-up window. To identify features, use View ‣ Identify
features or press Ctrl + Shift + I, or click on the  Identify features icon in the toolbar.
If you click on several features, the Identify results dialog will list information about all the selected features. The first item is the number of the layer in the list of results, followed by the layer name. Then, its first child will be the name of a field with its value. The first field is the one selected in Properties ‣ Display. Finally, all information about the feature is displayed.
このウィンドウはカスタムフィールドを表示するためにカスタマイズできますがデフォルトで3種類の情報を表示します:
- Actions: Actions can be added to the identify feature windows. When clicking on the action label, action will be run. By default, only one action is added, to view feature form for editing.
- Derived: This information is calculated or derived from other information. You can find clicked coordinate, X and Y coordinates, area in map units and perimeter in map units for polygons, length in map units for lines and feature ids.
- Data attributes: This is the list of attribute fields from the data.
Figure Identify 1:
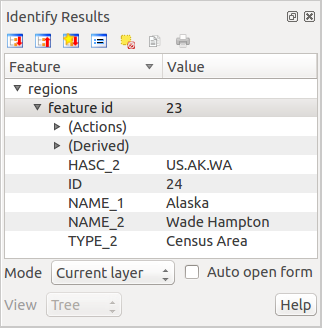
Identify feaures dialog (Gnome)
At the top of the window, you have five icons:
 Expand tree
 Collapse tree
 Default behaviour
 Copy attributes
 Print selected HTML response
At the bottom of the window, you have the Mode and View comboboxes. With the Mode combobox you can define the identify mode: ‘Current layer’, ‘Top down, stop at first’, ‘Top down’ and ‘Layer selection’. The View can be set as ‘Tree’, ‘Table’ and ‘Graph’.
The identify tool allows you to auto open a form. In this mode you can change the feautures attributes.
その他の機能は、識別されたアイテムのコンテキストメニューにあります。たとえば、コンテキストメニューから次のことができます:
地物フォームの表示
地物のズーム
地物のコピー: すべての地物,のジオメトリと属性をコピーします;
- Toggle feature selection: adds identified feature to selection
属性値のコピー: あなたがクリックした属性値のみをコピーします。
- Copy feature attributes: Copy only attributes
結果のクリア:ウィンドウ内の結果が削除されます
ハイライトのクリア:地図上でハイライトしている地物が除去されます
すべてをハイライトする
レイヤをハイライトする
レイヤのアクティベート: アクティベートするレイヤの選択
レイヤプロパティ: レイヤプロパティウィンドウを表示する
すべてを展開する
すべてを折りたたむ
整飾
The Decorations of QGIS include the Grid, the Copyright Label, the North Arrow and the Scale Bar. They are used to ‘decorate’ the map by adding cartographic elements.
グリッド
 グリッド では座標のグリッドと座標注記をマップキャンバスに追加します。
Figure Decorations 1:
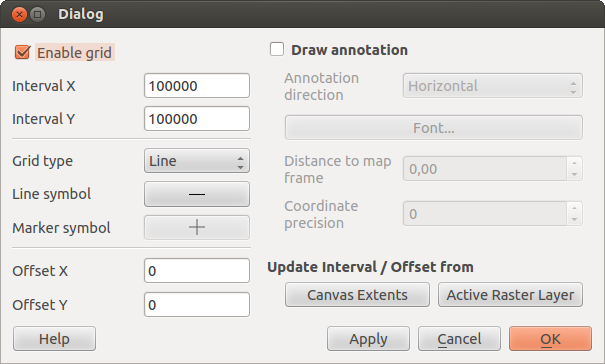
The Grid Dialog
- Select from menu View ‣ Decorations ‣ Grid. The dialog starts (see figure_decorations_1).
マップキャンバスにロードされているレイヤにしたがって
Enable grid チェックボックスを有効にしてグリッドの設定を行って下さい.マップキャンバスにロードされているレイヤにしたがって
Draw annotations チェックボックスを有効にしてアノテーションの定義を行ってください.- Click [Apply] to verify that it looks as expected.
- Click [OK] to close the dialog.
著作権ラベル
 Copyright label adds a copyright label using the text
you prefer to the map.
Copyright label adds a copyright label using the text
you prefer to the map.
Figure Decorations 2:
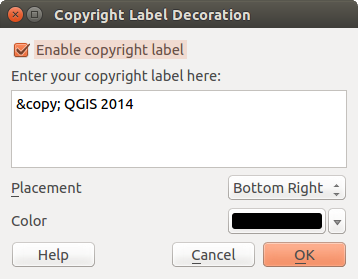
The Copyright Dialog
メニューの ビュー‣ 地図整飾 ‣ 著作権ラベル を選択します。ダイアログが表示されます( figure_decorations_2 を参照すること)。
マップ上に配置したいテキストを入力してください.例に示す通りHTMLを使用することができます.
- Choose the placement of the label from the Placement
 combo box.
 - Make sure the Enable Copyright Label checkbox is
checked.
- Click [OK].
In the example above, which is the default, QGIS places a copyright symbol followed by the date in the lower right-hand corner of the map canvas.
北向き矢印
![]() North Arrow places a simple north arrow on the map canvas.
At present, there is only one style available. You can adjust the angle of the
arrow or let QGIS set the direction automatically. If you choose to let QGIS
determine the direction, it makes its best guess as to how the arrow should be
oriented. For placement of the arrow, you have four options, corresponding to
the four corners of the map canvas.
North Arrow places a simple north arrow on the map canvas.
At present, there is only one style available. You can adjust the angle of the
arrow or let QGIS set the direction automatically. If you choose to let QGIS
determine the direction, it makes its best guess as to how the arrow should be
oriented. For placement of the arrow, you have four options, corresponding to
the four corners of the map canvas.
Figure Decorations 3:
The North Arrow Dialog
スケールバー
 Scale Bar adds a simple scale bar to the map canvas. You
can control the style and placement, as well as the labeling of the bar.
Scale Bar adds a simple scale bar to the map canvas. You
can control the style and placement, as well as the labeling of the bar.
Figure Decorations 4:
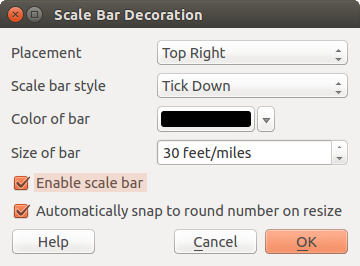
The Scale Bar Dialog
QGIS only supports displaying the scale in the same units as your map frame. So if the units of your layers are in meters, you can’t create a scale bar in feet. Likewise, if you are using decimal degrees, you can’t create a scale bar to display distance in meters.
スケールバーを追加するために:
メニューの ビュー ‣ 地図整飾 ‣ 著作権ラベル を選択して下さい.ダイアログが表示されます( figure_decorations_4 を参照して下さい).
- Choose the placement from the Placement combo box.
- Choose the style from the Scale bar style
combo box.
- Select the color for the bar Color of bar
 or use
the default black color.
or use
the default black color. - Set the size of the bar and its label Size of bar
 .
. - Make sure the Enable scale bar checkbox is checked.
- Optionally, check Automatically snap to round number
on resize.
- Click [OK].
ちなみに
整飾の設定
.qgs プロジェクトを保存する際,グリッド,方位記号,スケールバーと著作権ラベルに加えた変更はそのプロジェクトに保存され,次回プロジェクトをロードした際に復元されます.
アノテーションツール
The  Text Annotation tool in the attribute
toolbar provides the possibility to place formatted text in a balloon on the
QGIS map canvas. Use the Text Annotation tool and click into the
map canvas.
Text Annotation tool in the attribute
toolbar provides the possibility to place formatted text in a balloon on the
QGIS map canvas. Use the Text Annotation tool and click into the
map canvas.
Figure annotation 1:
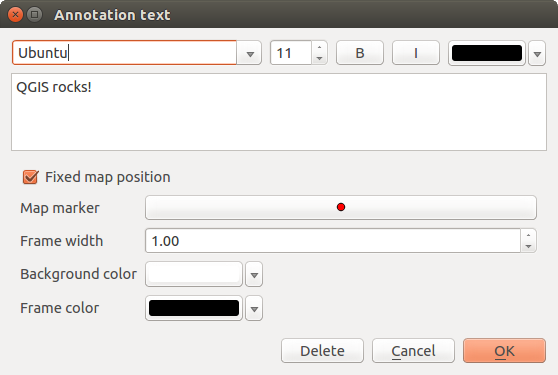
Annotation text dialog
項目をダブルクリックすると、さまざまなオプションを含むダイアログが開きます。フォーマットされたテキストやその他の項目の設定値を入力するテキストエディタがあります。例えば、マップの位置(マーカーシンボルが表示された)に関する項目またはスクリーンの位置(マップに関連していない)における選択肢を持ちます。この項目はマップの位置(マップマーカーをドラッグすることにより)が移動し、またはバルーンのみが移動します。アイコンは、GISの主題図の一部であり、それらも、他の主題図においてデフォルトとして用いられます。
The  Move Annotation tool allows you to move the
annotation on the map canvas.
Move Annotation tool allows you to move the
annotation on the map canvas.
HTML注記
The  Html Annotation tools in the attribute
toolbar provides the possibility to place the content of an html file in a
balloon on the QGIS map canvas. Using the Html Annotation tool, click
into the map canvas and add the path to the html file into the dialog.
Html Annotation tools in the attribute
toolbar provides the possibility to place the content of an html file in a
balloon on the QGIS map canvas. Using the Html Annotation tool, click
into the map canvas and add the path to the html file into the dialog.
SVG注記
The  SVG Annotation tool in the attribute toolbar
provides the possibility to place an SVG symbol in a balloon on the QGIS map
canvas. Using the SVG Annotation tool, click into the map canvas and
add the path to the SVG file into the dialog.
SVG Annotation tool in the attribute toolbar
provides the possibility to place an SVG symbol in a balloon on the QGIS map
canvas. Using the SVG Annotation tool, click into the map canvas and
add the path to the SVG file into the dialog.
注記の書式設定
Additionally, you can also create your own annotation forms. The
Form Annotation tool is useful to display
attributes of a vector layer in a customized Qt Designer form (see
figure_custom_annotation). This is similar to the designer forms for the
Identify features tool, but displayed in an annotation item.
Also see this video https://www.youtube.com/watch?v=0pDBuSbQ02o from
Tim Sutton for more information.
Figure annotation 2:
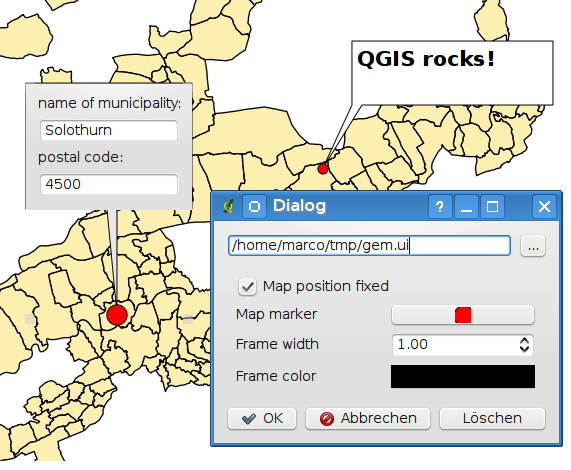
Customized qt designer annotation form
ノート
If you press Ctrl+T while an Annotation tool is active (move annotation, text annotation, form annotation), the visibility states of the items are inverted.
空間ブックマーク
Spatial Bookmarks allow you to “bookmark” a geographic location and return to it later.
ブックマークの作成
ブックマークを作るには:
関心のある領域にズームまたはパンします。
- Select the menu option View ‣ New Bookmark or press Ctrl-B.
ブックマークを説明する名称(255文字まで)を入力します。
- Press Enter to add the bookmark or [Delete] to remove the bookmark.
同じ名称で複数のブックマークを所有できることにご注意ください。
ブックマークの操作
To use or manage bookmarks, select the menu option View ‣ Show Bookmarks. The Geospatial Bookmarks dialog allows you to zoom to or delete a bookmark. You cannot edit the bookmark name or coordinates.
Zooming to a Bookmark
From the Geospatial Bookmarks dialog, select the desired bookmark by clicking on it, then click [Zoom To]. You can also zoom to a bookmark by double-clicking on it.
Deleting a Bookmark
To delete a bookmark from the Geospatial Bookmarks dialog, click on it, then click [Delete]. Confirm your choice by clicking [Yes], or cancel the delete by clicking [No].
Import or export a bookmark
To share or transfer your bookmarks between computers you can use the Share pull down menu in the Geospatial Bookmarks dialog.
プロジェクトの入れ子
あなたのプロジェクトに他のプロジェクトファイルからコンテンツを埋め込む場合 Layer ‣ 埋め込みレイヤとグループ を選択して下さい.
埋め込みレイヤ
次のダイアログで,他のプロジェクトのレイヤを埋め込むことができます.
- Press
 to look for another project from the Alaska dataset.
 - Select the project file grassland. You can see the content of the project (see figure_embed_dialog).
- Press Ctrl and click on the layers grassland and regions. Press [OK]. The selected layers are embedded in the map legend and the map view now.
Figure Nesting 1:
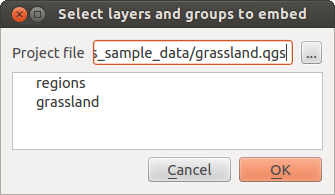
Select layers and groups to embed
埋め込まれているレイヤが編集可能になっている間,スタイルやラベリングのようなプロパティは変更することができません.
埋め込みレイヤの除去
Right-click on the embedded layer and choose  Remove.